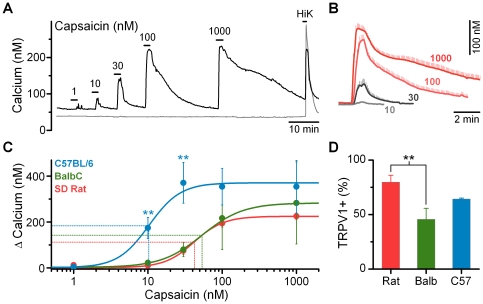
Figure 2. Comparison of responses to CAP in nodose ganglion neurons from SD rat, BalbC mouse, and C57BL/6 mouse. A).
CAP induces dose dependent increases in cytosolic calcium concentrations in a subpopulation of vagal afferents (black). Some neurons are resistant to CAP even at the highest concentrations tested, but increase calcium following depolarization indicating normal cell viability (gray). Traces are from representative neurons taken from a SD rat. B) High concentrations of CAP increased both the peak and integrated calcium responses. Traces are averages ± SEM across responsive neurons from SD rat (n = 22). C) CAP dose response relationships across species: C57BL/6 mouse, n = 8, EC50 = 10 ± 2 nM CAP, slope = 2.09 ± 0.53, max = 371 ± 89 nM calcium; BalbC mouse, n = 4, EC50 = 54 ± 26 nM CAP, slope = 1.59 ± 0.70 max = 283 ± 179 nM calcium; and SD rat, n = 22, EC50 = 42 ± 6 nM CAP, slope = 2.21 ± 0.29, max = 225 ± 15 nM calcium. Peak calcium influx was not significantly different between groups (ANOVA, P = 0.84); however, the EC50 was lower in neurons from C57BL/6 mice compared to both SD rat and BalbC mice due to larger calcium responses at the 10 nM (P < 0.001) and 30 nM (P < 0.001) CAP concentrations. D) Percent of neurons responsive to CAP (100 nM) relative to all HiK responsive neurons within an isolation (SD rat, 80 ± 6%, combined n = 51/63; BalbC, 46 ± 10%, combined n = 38/82; C57BL/6, 64 ± 1%, combined n = 27/42). Both strains of mice had lower percentages of CAP responsive afferents; with the BalbC (Holm-Sidak post-hoc test, P = 0.009), but not the C57BL/6 (Holm-Sidak post-hoc test, P = 0.40) afferents statistically lower compared to those taken from the SD rat.

