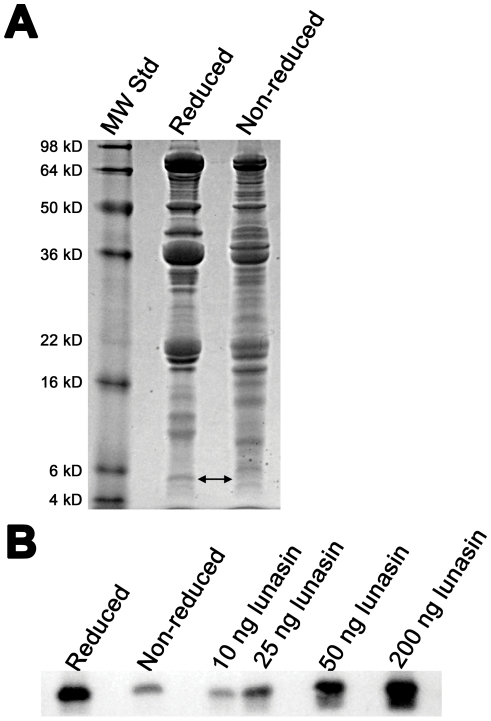
Figure 4. Quantitation of lunasin and lunasin complex in clarified extracts.
White flake (120 g) was extracted with 1.5 L of 75.5 mM sodium phosphate/150 mM NaCl/20 mM ascorbic acid/10 mM sodium metabisulfite, pH 7.4 for one hour. A clarified extract was produced by treating the initial extract with Celpure P100 and filtration using one micron M-503 filter pads. (A) SDS-PAGE analysis of reduced and non-reduced clarified extract. The clarified extract was diluted 1∶10 and analyzed by SDS-PAGE using a 15% Tris-glycine gel under standard reducing and non-reducing (without BME in the sample buffer) conditions. Molecular weight standards (MW Std) are shown in the first lane. The arrow indicates a ∼5 kDa band that corresponds to lunasin. The lack of a clear lunasin band in the sample analyzed under non-reducing conditions indicates that most of the lunasin present in the clarified extract is in protein complexes stabilized by disulfide bridges. (B) Immunoblot analysis of reduced and non-reduced clarified extract. Clarified extract was diluted 1∶10 and subjected to SDS-PAGE along with a series of synthetic lunasin standards as described in (A). The separated proteins were transferred to a PVDF membrane and probed with a lunasin-specific mouse monoclonal antibody diluted 1∶100,000. The amount of lunasin present was determined by image analysis using the synthetic lunasin band intensities to generate a standard curve. This analysis demonstrated that <20% of the extractable lunasin is present in the ∼5 kDa form.

