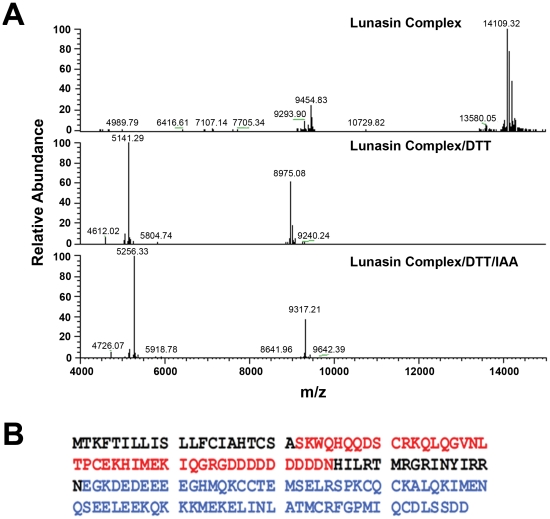
Figure 7. Mass spectrometry of the purified lunasin-containing complex.
(A, top panel) Deconvoluted spectrum of purified lunasin complex. The most abundant isotopic mass in the spectrum is at 14109.3 Da. The mass signal adjacent to lunasin complex (14207.3 Da) is the adduct of lunasin complex with phosphoric acid (plus 98 Da). (A, middle panel) Deconvoluted spectrum of reduced lunasin complex. The most abundant isotopic masses shown in the spectrum are lunasin (5141.3 Da) and soybean albumin long chain (8975.1 Da). (A, bottom panel) Deconvoluted spectrum of lunasin complex treated with DTT and IAA. The most abundant masses shown in the spectrum are lunasin (5256.3 Da) and soybean albumin long chain (9317.2 Da). The monoisotopic masses are 5139.28 Da and 5253.33 Da for lunasin and lunasin treated with DTT and IAA respectively. The monoisotopic masses of lunasin complex and soybean albumin long chain were too low to be detected. (B) Sequence of 2S albumin preproprotein. Sequence in red is corresponds to our purified lunasin and its monoisotopic and average molecular weights are 5139.27 and 5142.43 Da, respectively. Sequence in blue corresponds to soybean albumin long chain and its monoisotopic and average molecular weights are 8969.05 and 8975.17 Da, respectively.

