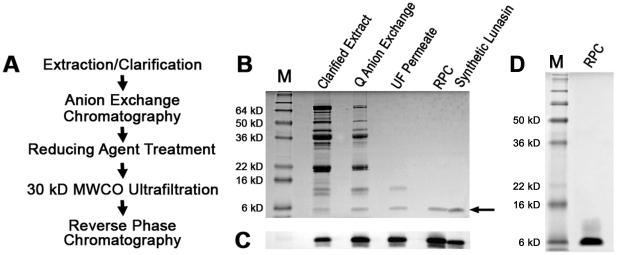
Figure 8. Pilot scale lunasin purification.
A) Flow diagram of the optimized lunasin purification method. (B) Coomassie-stained SDS-PAGE gel of protein samples representing each stage of the pilot-scale purification. SDS-PAGE using a 15% Tris-glycine gel and diluted samples of clarified extract (1∶20), Q anion-exchange fraction (1∶40), UF permeate (1∶20), and RPC fraction (1∶40). Synthetic lunasin (500 ng) was loaded as a positive control. Molecular weight standards (M) are shown in the first lane. (C) Immunoblot analysis of protein samples representing each stage of pilot-scale purification. Proteins separated by SDS-PAGE as described for (B) were transferred to a PVDF membrane and probed with a lunasin-specific mouse monoclonal antibody. Lunasin was detected in all the samples as a band with an apparent molecular weight of ∼5 kDa. (D) Coomassie-stained SDS-PAGE gel of final RPC-purified lunasin product. SDS-PAGE was performed on a 15% gel using 10 µg of RPC-purified lunasin. Molecular weight standards (M) are shown in the first lane.

