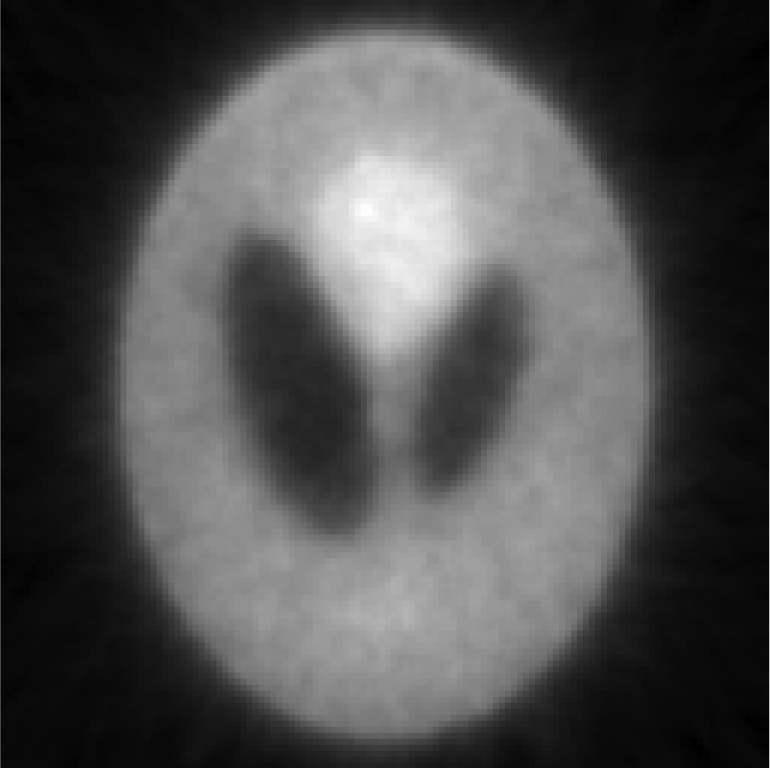
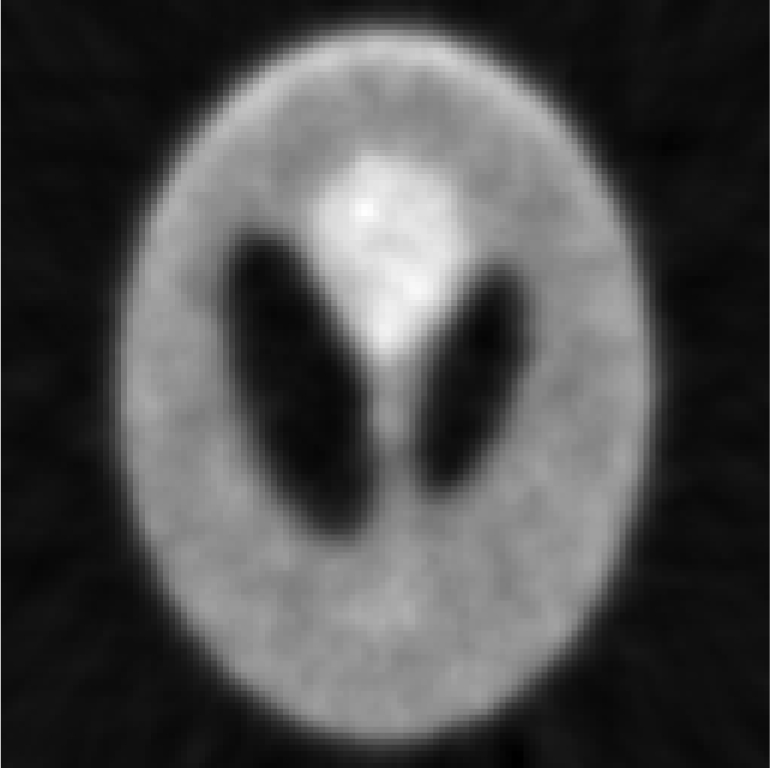
. 2012 Mar 28;39(4):2170–2178. doi: 10.1118/1.3697736

TABLE IV.

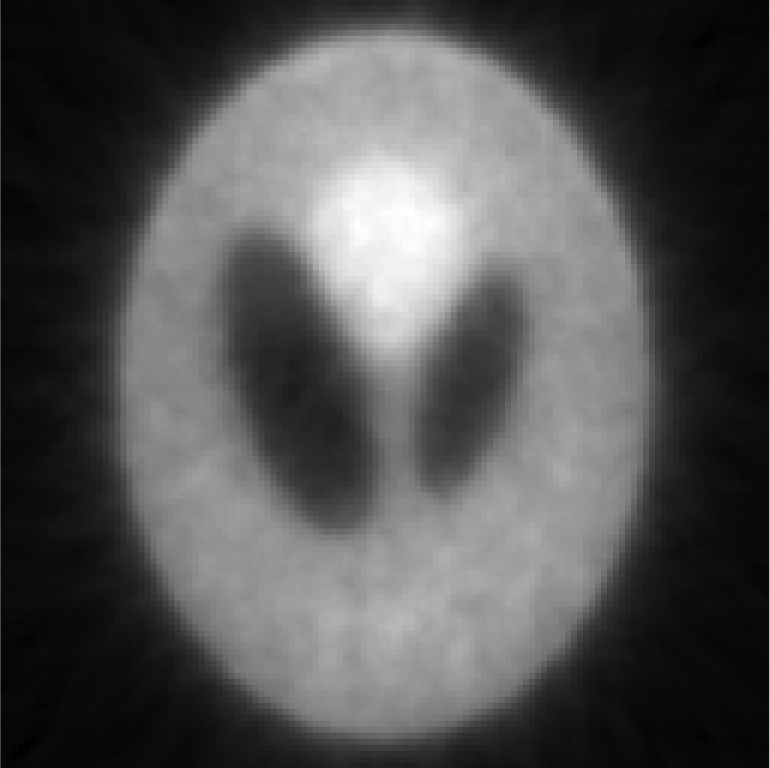
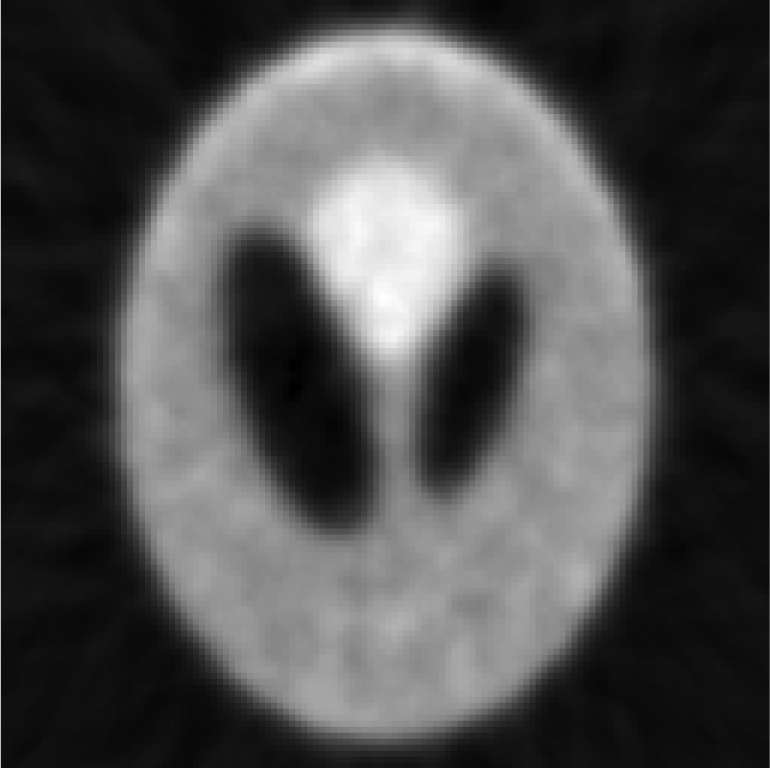
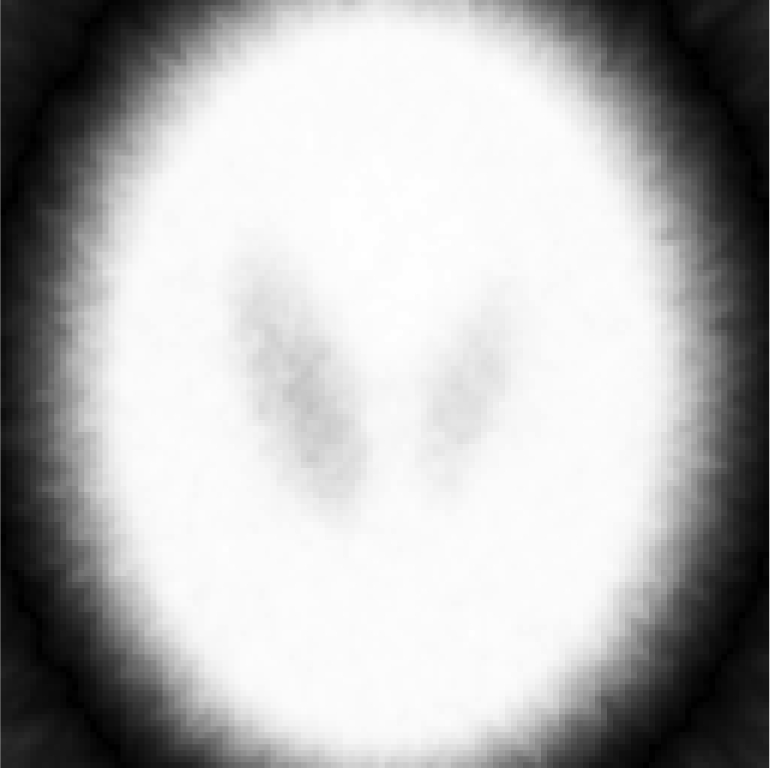
Iterative MAP vs FBP-MAP with β = 0.3 using noisy data.

  Iteration index k = 2 k = 20 k = 200
One iterative reconstruction graphic file with name MPHYA6-000039-002170_1-id34.jpg graphic file with name MPHYA6-000039-002170_1-id35.jpg graphic file with name MPHYA6-000039-002170_1-id36.jpg
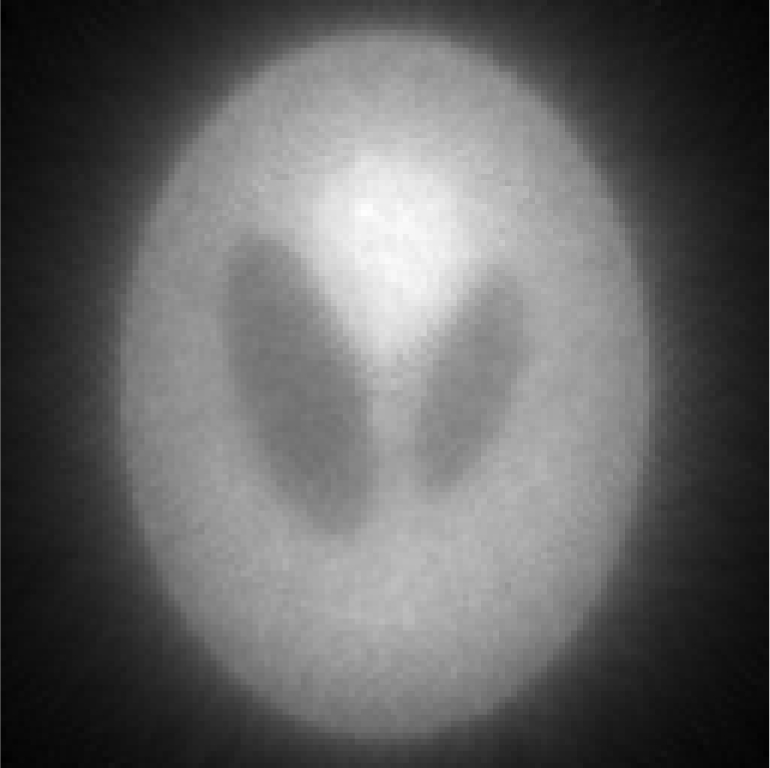
One FBP reconstruction graphic file with name MPHYA6-000039-002170_1-id37.jpg graphic file with name MPHYA6-000039-002170_1-id38.jpg graphic file with name MPHYA6-000039-002170_1-id39.jpg
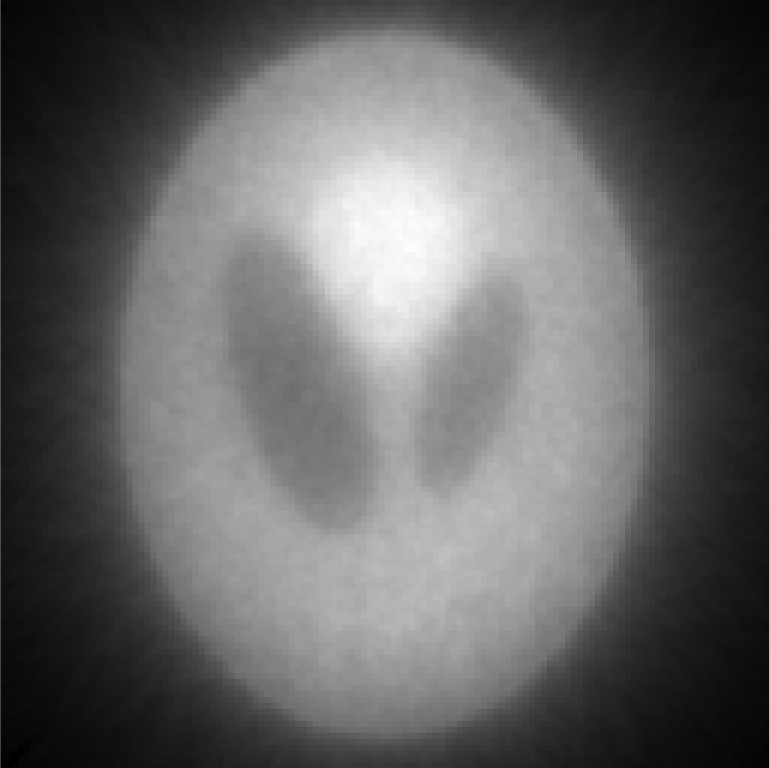
S/N image from 100 noise realizations of iterative reconstructions graphic file with name MPHYA6-000039-002170_1-id40.jpg graphic file with name MPHYA6-000039-002170_1-id41.jpg graphic file with name MPHYA6-000039-002170_1-id42.jpg
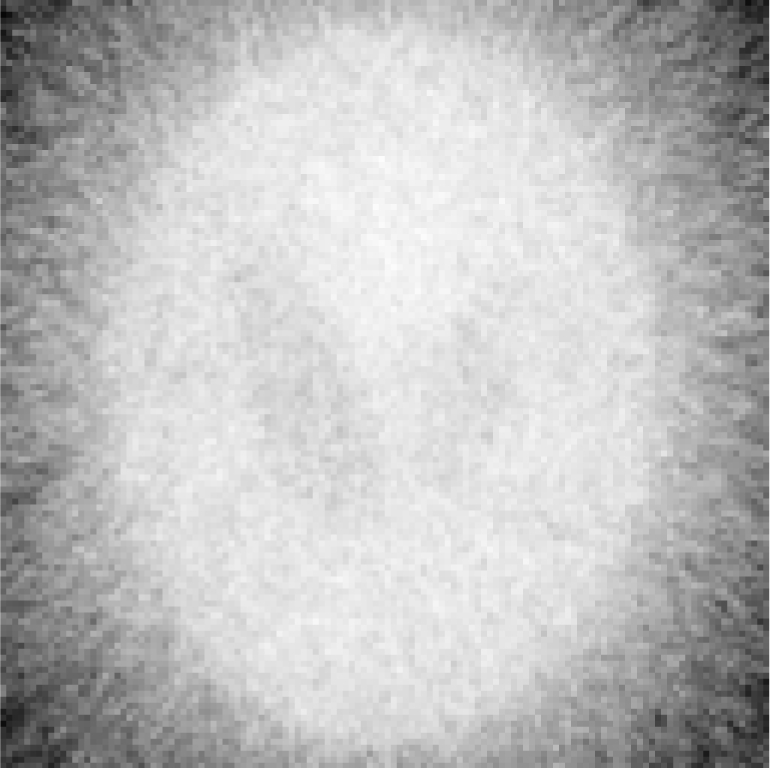
S/N image from 100 noise realizations of FBP reconstructions graphic file with name MPHYA6-000039-002170_1-id43.jpg graphic file with name MPHYA6-000039-002170_1-id44.jpg graphic file with name MPHYA6-000039-002170_1-id45.jpg
Central horizontal profiles of the S/N images (vertical scale is from 0 to 250)
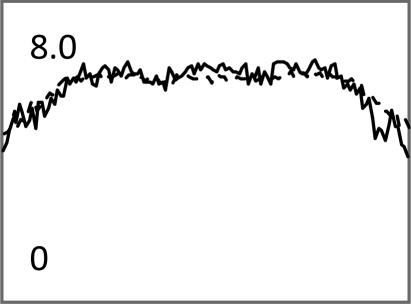
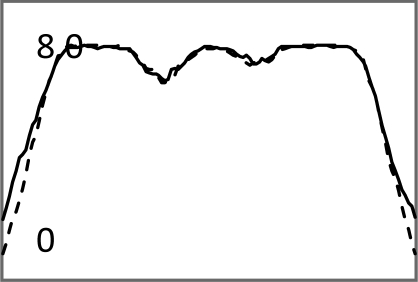
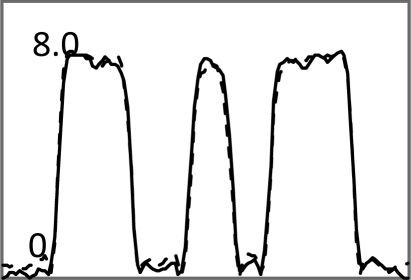
 graphic file with name MPHYA6-000039-002170_1-id46.jpg graphic file with name MPHYA6-000039-002170_1-id47.jpg graphic file with name MPHYA6-000039-002170_1-id48.jpg