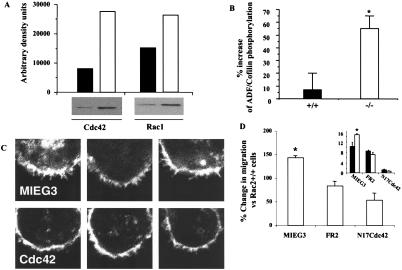
Figure 4.
Biochemical analysis of activation of Cdc42 and Rac1 and downstream targets in hematopoietic stem and progenitor cells from Rac2−/− mice. (A) Increased Cdc42 and Rac1 activation in Rac2−/− cells as analyzed by GST-PAK1 p21-binding domain pull-down (18), one of three experiments showing similar results. (Upper) Densitometric determination of immunoblot bands shown below. Closed bars, WT cells; open bars, Rac2−/− cells. (B) Increased inhibitory phosphorylation of ADF/cofilin as measured by immunoblot with phosphorylation-specific polyclonal antibody (anti-pADF, 1:100 dilution) (34). Closed bars, WT cells; open bars, Rac2−/− cells. Data are mean ± SD of densitometric determination of four independent experiments. *, P < 0.01. (C) Reversal of filopodia as analyzed by confocal microscopy performed after staining with 0.1 μg/ml rhodamine phalloidin after expression of dominant negative Cdc42 (Lower) or empty vector MIEG3 (Upper). The T17NCdc42 mutant and WT Rac2 (not shown) were introduced into the cells via the retrovirus vectors pMX-IRES (35, 36) and MIEG3-FR2, respectively, with published methods (20). (D) Reversal of increased migration of Rac2−/− vs. Rac2+/+ HSC/P cells after stimulation with SDF-1 analyzed in a transwell chamber assay after expression of empty vector (MIEG3), WT Rac2 (FR2), or N17Cdc42. The data are expressed as percentage change vs. Rac2WT (+/+) cells (*, P = 0.02, n = 3). (Inset) Migration data expressed as percentage of cells migrating, showing increased migration of Rac2−/− cells (open bars) expressing empty vector (MIEG3), which is reduced by expression of Rac2 (FR2). Expression of N17Cdc42 further reduces migration, but to a larger degree in Rac2−/− cells.

