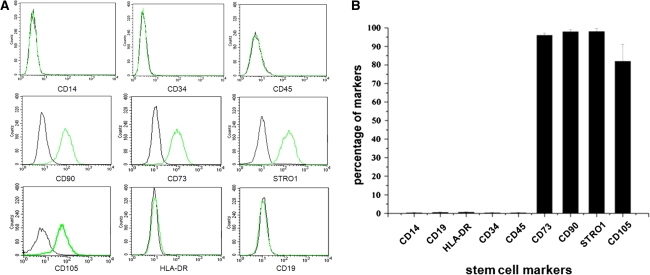
Fig. 4.
Stem cell markers analyzed by flow cytometry. a The green lines represent the fluorescence intensity of cells stained with the indicated antibodies, and the black lines represent the isotype-matched negative controls, b percentages of CEP-derived cells expressing different stem cell markers. Each group contains seven CEP cell samples (n = 7)

