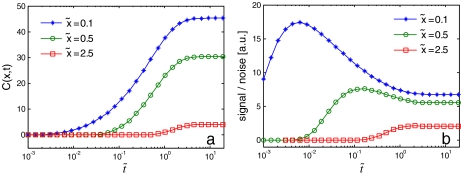
Fig. 2.
a Bcd concentration (7) at three different points along the A-P axis:  0.1, 0.5 and 2.5 (
 0 is the anterior pole), as a function of normalized time
  . λ and D are set equal to 1, s0 = 100.
  and
and  were normalized according to:
  ,
,  . b Signal-to-noise ratio (Eq. (10), arbitrary units; (a.u.)), as a function of normalized time
  - for the same three positions as in a. High ratio values correspond to higher levels of precision. Both plots start from pre-steady-state and reach steady state (0
  20)
20)

