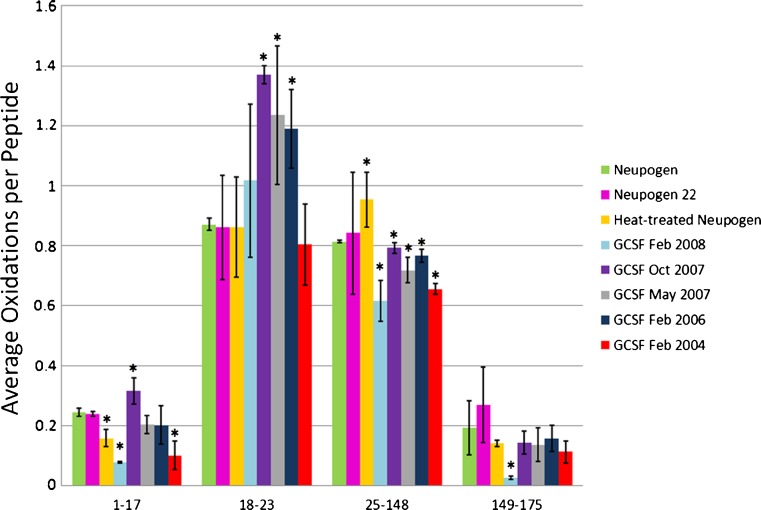
Fig. 1.
Hydroxyl radical footprinting of GCSF samples. Each set of bars represents one peptide from Neupogen® (green), Neupogen22 (pink), heat-treated Neupogen® (yellow), or recombinant GCSF samples generated in Feb 2008 (light blue), Oct 2007 (purple), May 2007 (gray), Feb 2006 (navy), or Feb 2004 (red). The y-axis represents the average number of oxidation events per peptide in the sample. Error bars 2 SD from a triplicate set of FPOP oxidations and analyses. Asterisks peptides with oxidation levels that significantly different than Neupogen® (p ≤ 0.01)

