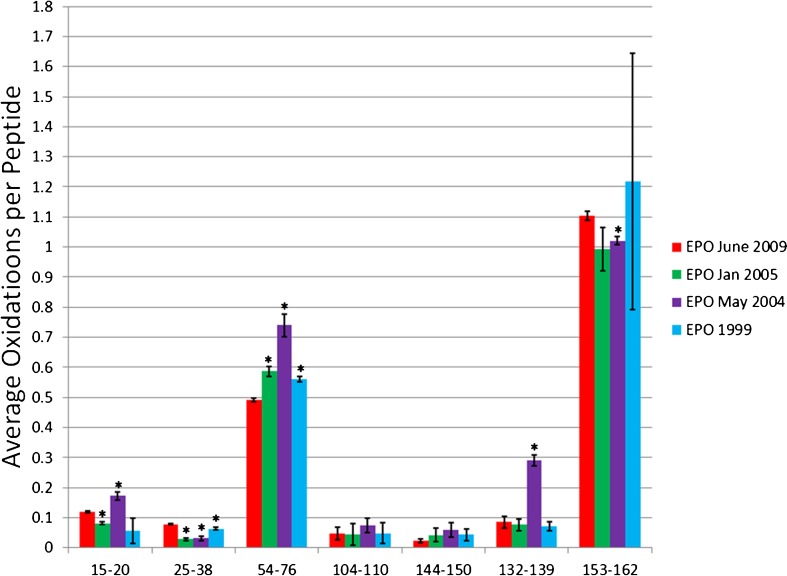
Fig. 5.
Hydroxyl radical footprinting of EPO samples. Each set of bars represents one peptide from recombinant EPO samples generated in 2009 (red), Jan 2005 (green), May 2004 (purple), and 1999 (blue). The y-axis represents the average number of oxidation events per peptide in the sample. Error bars represent 2 SD from a triplicate set of FPOP oxidations and analyses. Asterisks peptides with oxidation levels that significantly different than EPO 2009 (p ≤ 0.01)

