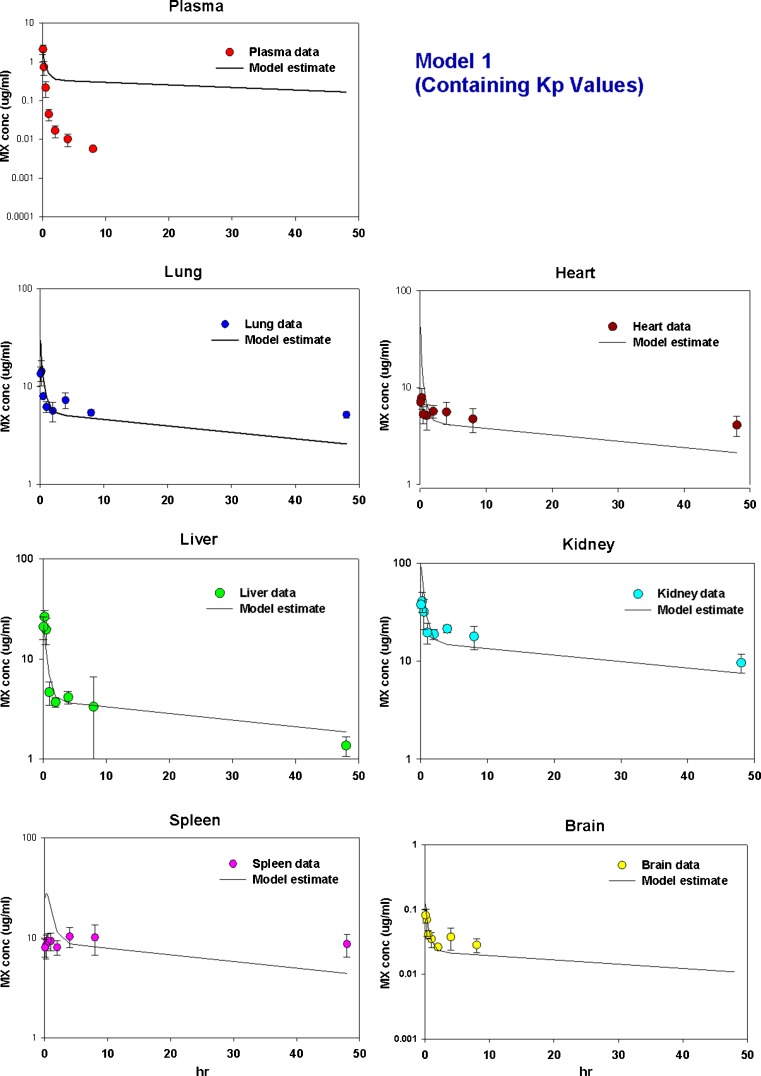
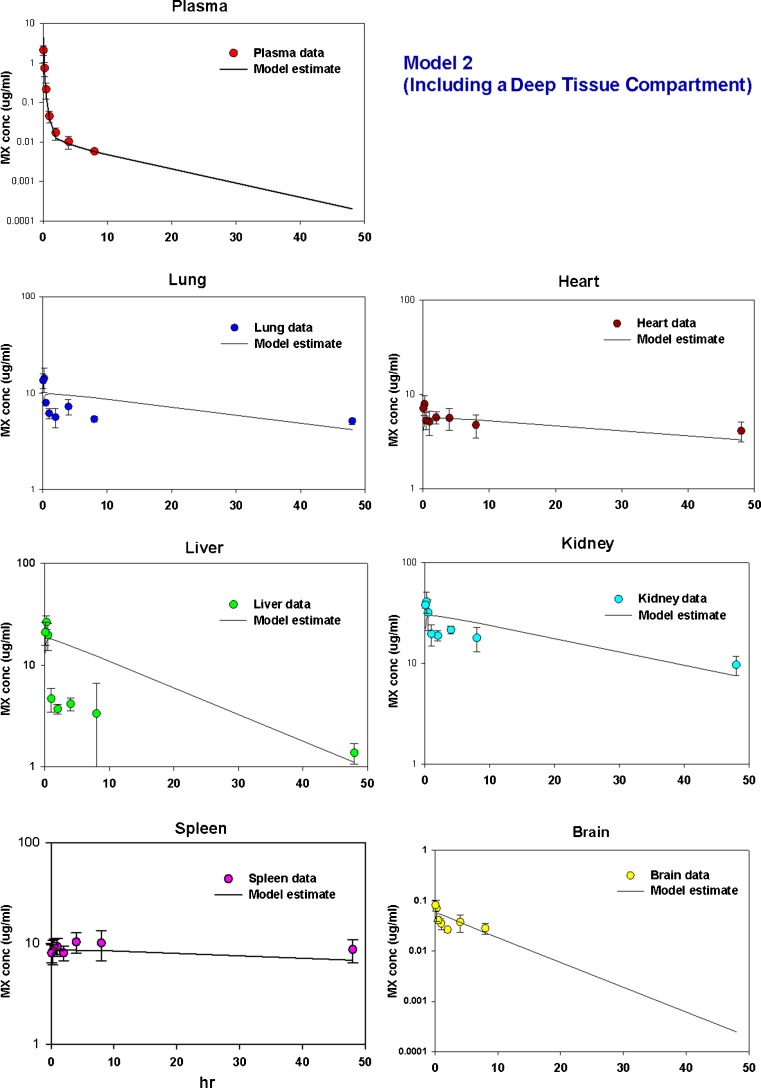
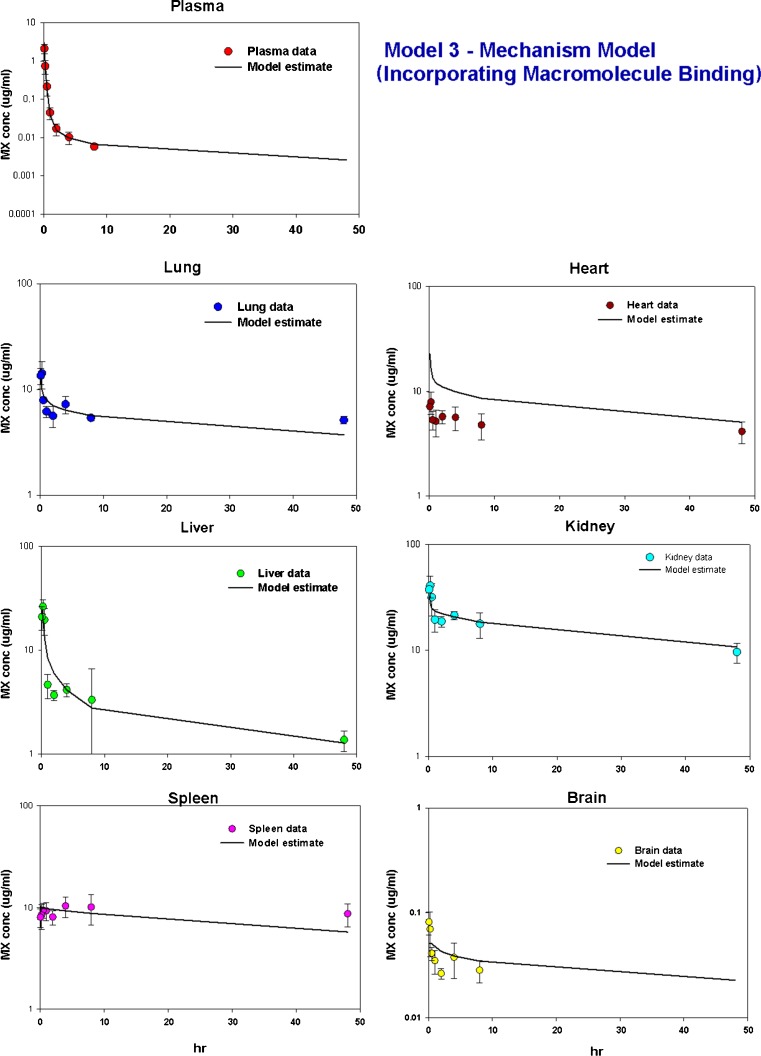
Fig. 5.
Time courses of measured and predicted mitoxantrone concentrations in plasma, lung, heart, liver, kidney, and spleen and brain in mice using a Model 1 (containing Kp values), b Model 2 (including a deep tissue compartment), and c Model 3 (incorporating DNA and other macromolecule binding). Solid symbols are the experimental values which were obtained as described in MATERIALS AND METHODS section. Solid lines are the predicted results which were obtained by simultaneous fitting of all data using ADAPT 5


