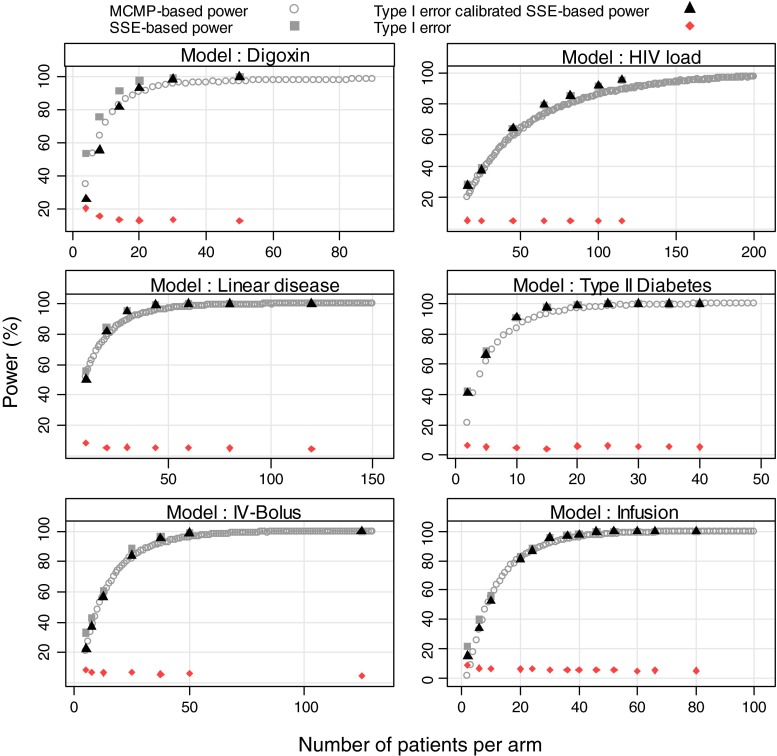
Fig. 2.
Outcome of predicted power study in six nonlinear mixed-effects models at varying sample size per study arm from stochastic simulation and estimation method (grey squares), stochastic simulation and estimation method (black triangles) calibrated with type I error rate (dark red diamond) and MCMP method (grey circle)

