
Figure 1. Gene expression over time in SSc Skin.
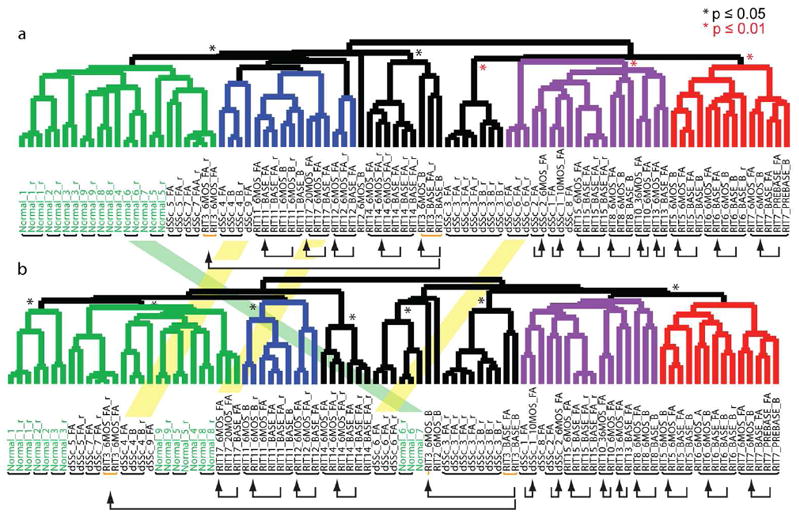
Shown are the hierarchical clustering dendrograms of the ‘intrinsic by patient’ (A) and ‘intrinsic by time point’ analyses (B). Dendrogram branches are colored by subtype: normal-like (green), inflammatory (purple), diffuse 1 (blue) and diffuse 2 (red) represent the diffuse-proliferation group. Statistically significant branches are indicated by an asterisk (Black *, p ≤ 0.05) and (red *, p ≤ 0.01). Black bars below the sample identifiers indicate arrays from skin biopsies from the same patient that clustered together, yellow bars below the identifiers identify arrays that split. Black arrows connect longitudinal samples. Overlaid between the two dendrograms are shaded bars indicating arrays that changed intrinsic subset between the two analyses.