
Figure 2. Recapitulation of the intrinsic subsets.
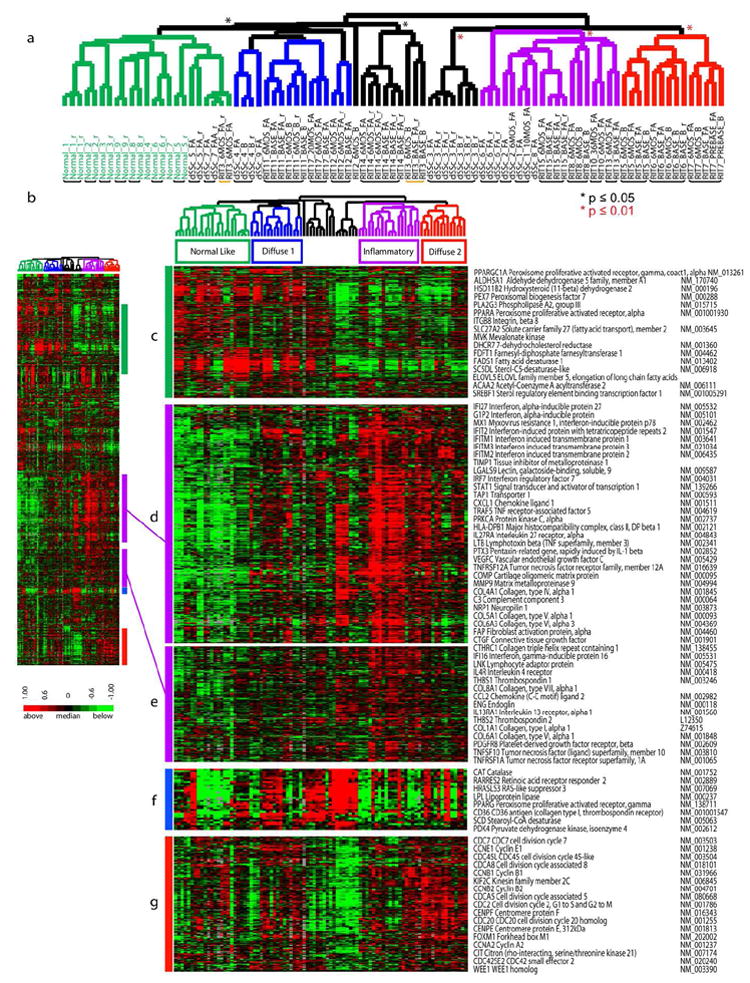
2377 genes were selected from 89 arrays (31 individuals) by ‘intrinsic by patient’ analysis. A. Hierarchical clustering dendrogram shows the normal-like (green branches), inflammatory (purple), and diffuse-proliferation groups (diffuse 1 (blue) and diffuse 2 (red)). Significance of clustering was determined by SigClust (p ≤ 0.05, black asterisk; p ≤ 0.01, red asterisk). Healthy control identifiers are green and dSSc are black. RIT indicates samples in the rituximab study. Black bars indicate patient samples that clustered together, the yellow bar indicates patient RIT 3 that did not cluster. B. Heat map of genes and samples clustered hierarchically. C. Fatty-acid synthesis genes. D and E. inflammatory and collagen genes. F. PPAR-γ genes. G. Proliferation cluster.