
Figure 3. Concordance between datasets.
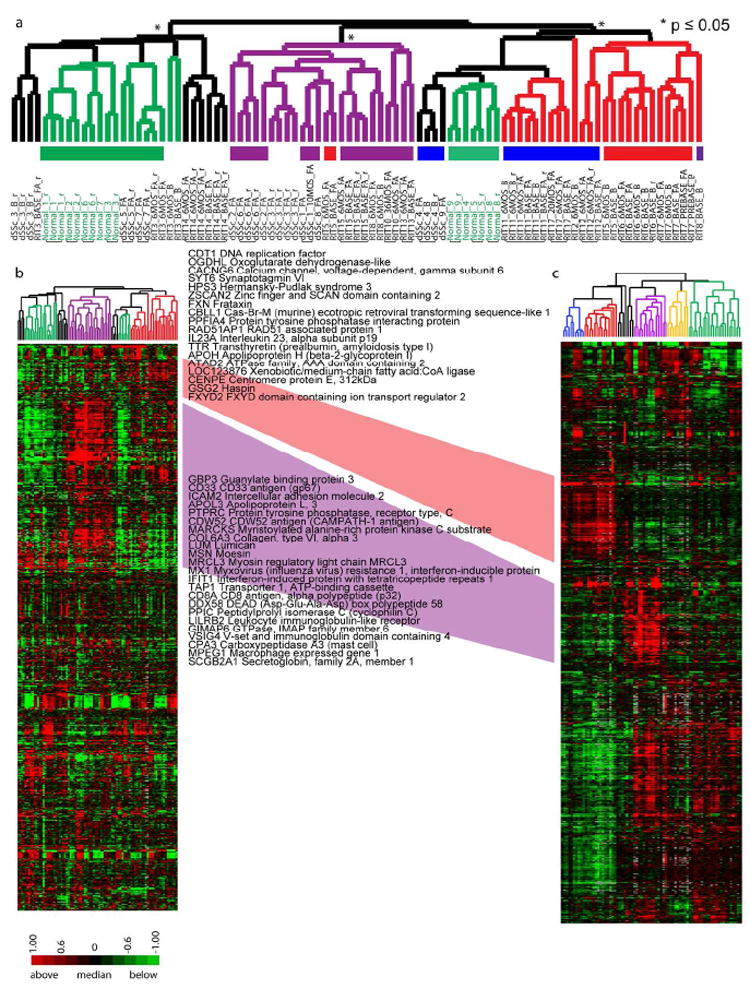
Hierarchical clustering of 808 genes that matched the 995 intrinsic genes from Milano et al (187 did not pass basic filtering criteria). A. Hierarchical clustering dendrogram shows normal-like (green), inflammatory (purple), diffuse-proliferation (diffuse 1 (blue) and diffuse 2 (red)), and limited groups (yellow). Significant branches are indicated (p ≤ 0.05, black asterisk; p ≤ 0.01, red asterisk). Black bars indicate subject samples that clustered together. B. Heat map for the 808 genes. C. Heat map of the original 995 ‘intrinsic’ genes in Milano et al. The diffuse-proliferation groups are between the two datasets are connected in red and the inflammatory groups connected in purple; genes found in the respective clusters of both datasets are indicated.