
Figure 4. Surrogate gene expression biomarkers of MRSS.
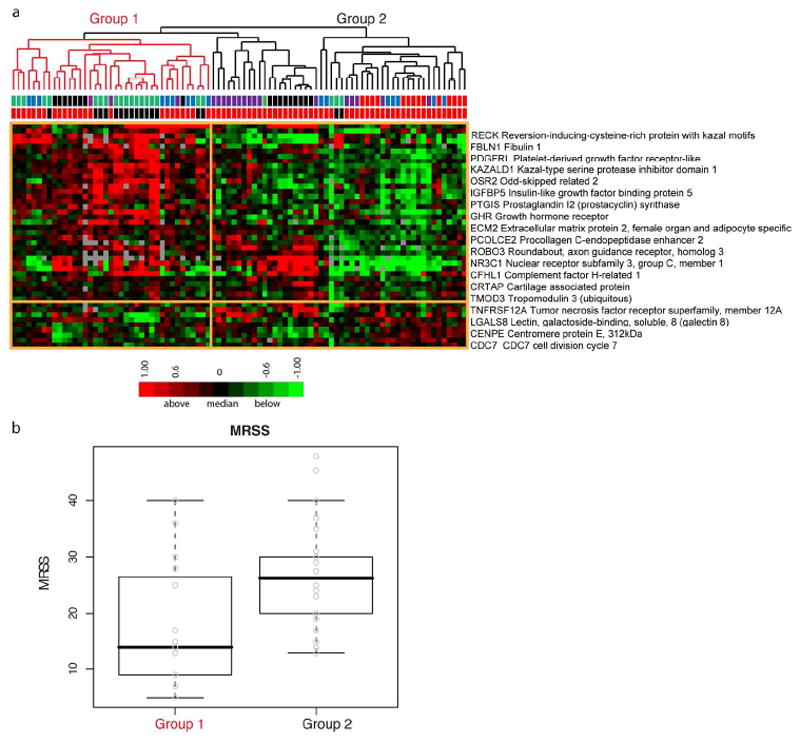
A. Probes that matched the 177 genes with correlations above |0.5| from Milano were extracted from the “by patient” intrinsic analysis resulting in 44 genes. Hierarchical clustering results in two groups. Group 1 (red branches) includes dSSc and healthy control skin biopsies, while group 2 (black branches) includes primarily dSSc skin biopsies. The first row below the dendrogram, bars indicate the intrinsic subset assignment in the ‘by patient’ analysis (normal-like, green; diffuse1, blue; diffuse2, red; inflammatory, purple; unclassified, black). The second row indicates sample diagnosis, dSSc (red) or healthy control (black). B. Comparison of MRSS between the two groups shows a statistically significant difference in MRSS (two sample t-test, p = 0.005).