
Figure 5. Consistent classification and expression gradients within subsets.
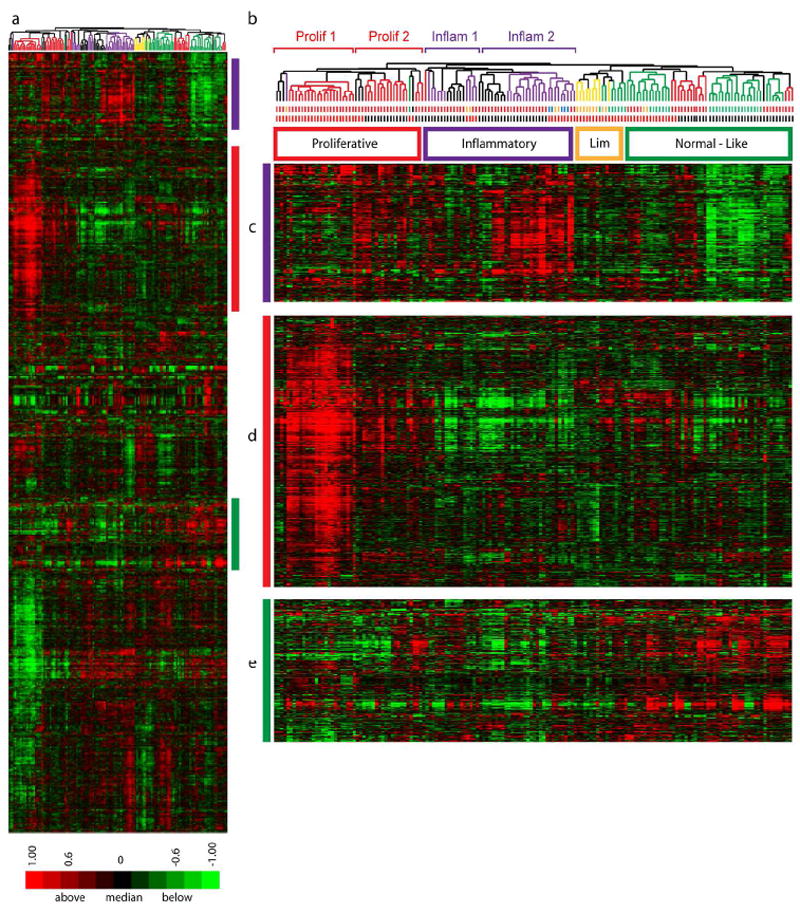
Data from this study and from Milano were merged to create a single dataset of 164 arrays. 3551 intrinsic genes were selected (FDR 0.07 %). A. Heat map of 2-dimensional hierarchical clustering. B. Clustering dendrogram with branches indicating the intrinsic subset each sample was assigned in the independent dataset analyses (proliferative (red), inflammatory (purple), limited (yellow), and normal-like (green)). The first row of bars below the dendrogram indicates patient diagnosis (dSSc, red; lSSc, yellow; Morphea and eosinophilic fasciitis, blue; healthy controls; green). The second row of bars indicates the dataset the samples were obtained: Milano, red; this study, black. C. Inflammatory cluster D. Proliferation cluster E. Fatty-Acid synthesis cluster.