
Figure 6. Association between disease duration and MRSS within the proliferation and inflamatory subsets.
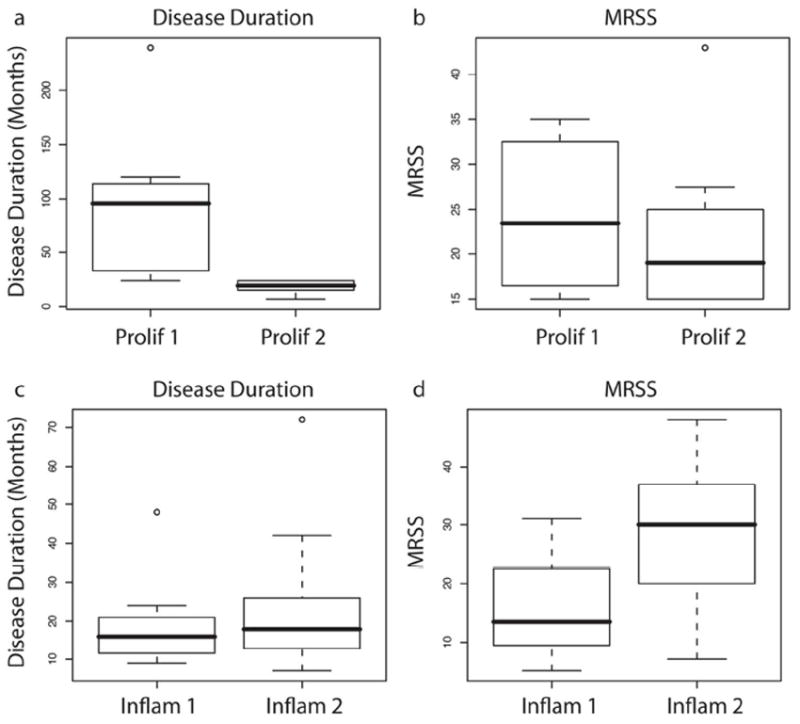
Above the dendrogram in Figure S6B, the ‘Prolif 1’, ‘Prolif 2’, ‘Inflam 1’ and ‘Inflam 2’ groups are indicated. These are groups showing differences in intensity of expression within the proliferative and inflammatory subsets. Differences in disease duration and MRSS between ‘Prolif 1’ and ‘Prolif 2’ (A and B), as well as between ‘Inflam 1’ and ‘Inflam 2’ are apparent (C and D).