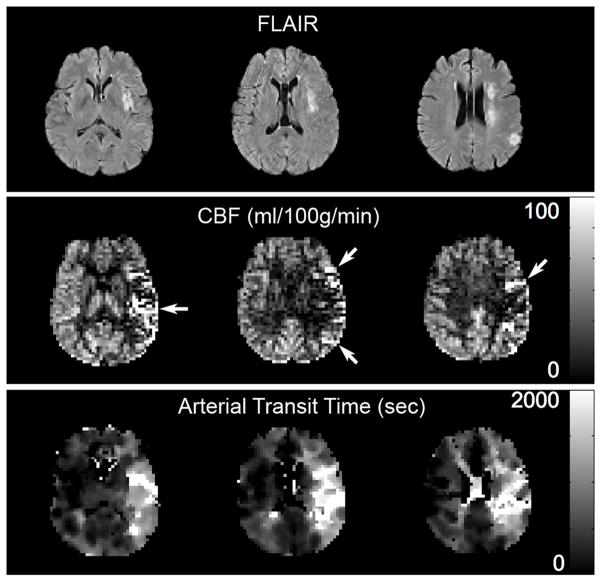
Figure 2.
Transit artifact in a patient with left middle cerebral artery stroke and a transit time map showing prolonged arterial transit to this region. TOP: FLAIR images showing multiple strokes in the left MCA distribution. MIDDLE: ASL CBF images show artifactual hyperperfusion in the left MCA distribution (arrows) due to delayed transit of label, which is imaged within leptomenigeal vessels providing collateral flow. CBF in left and right MCA distributions are actually nearly identical at 43 and 42 ml/100g/min, respectively. Bottom: Arterial transit time map demonstrates prolonged transit times to the left MCA distribution.

