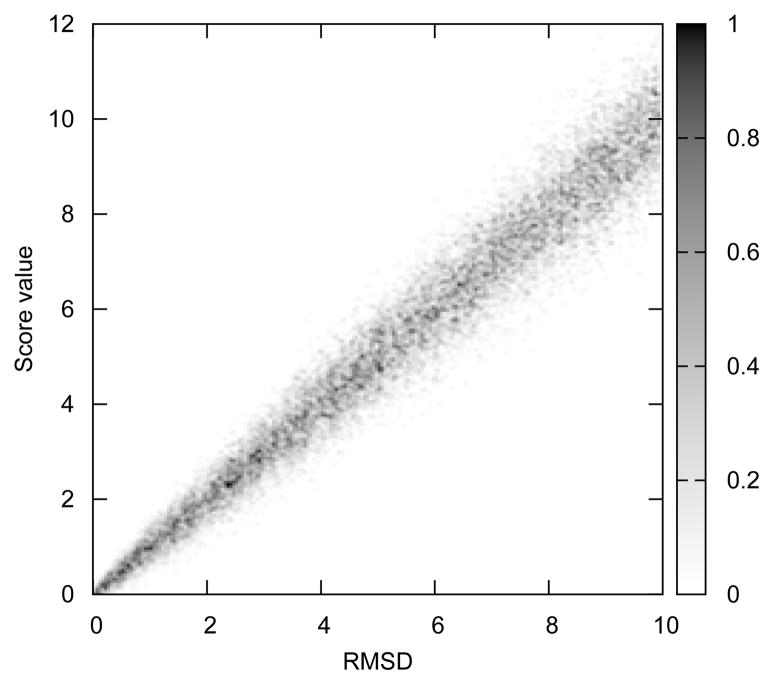
Figure 1.
Scoring function to assess the quality of generated decoys, computed from Eq. 3 (see text). Noise parameter σN is set to 0.25. The plot was computed from the distribution of energy vs. RMSD, at intervals of 0.05. For each bin, the distribution has been normalized to lie between 0 and 1.

