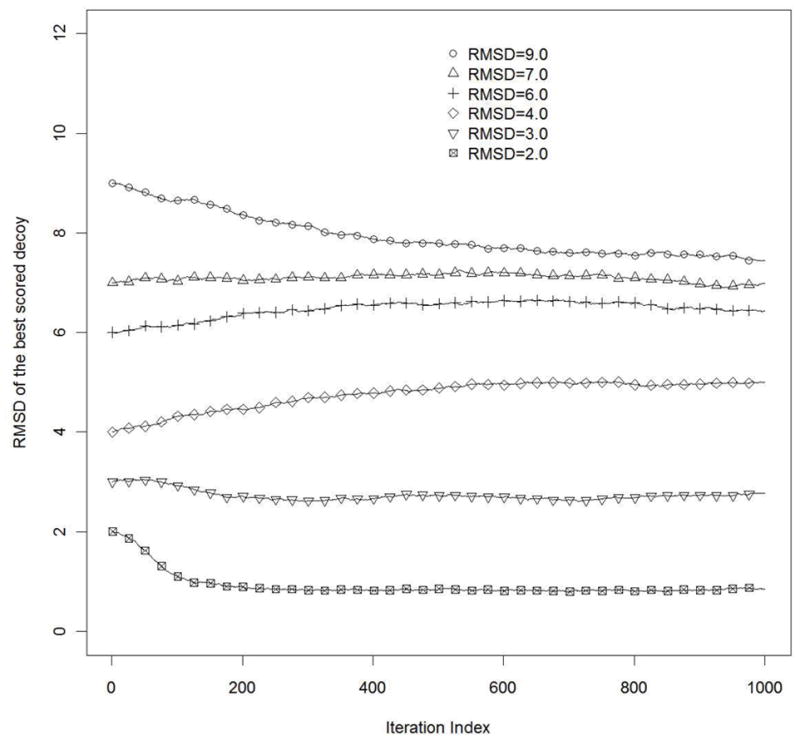
Figure 3.

RMSD of the best scored decoys from the native structure during refinement iterations. Curves are computed for different values of the initial models quality (RMSD) with L=125, σN = 0.20 and σC = 0.10. Averaging was performed over 250 simulations.
