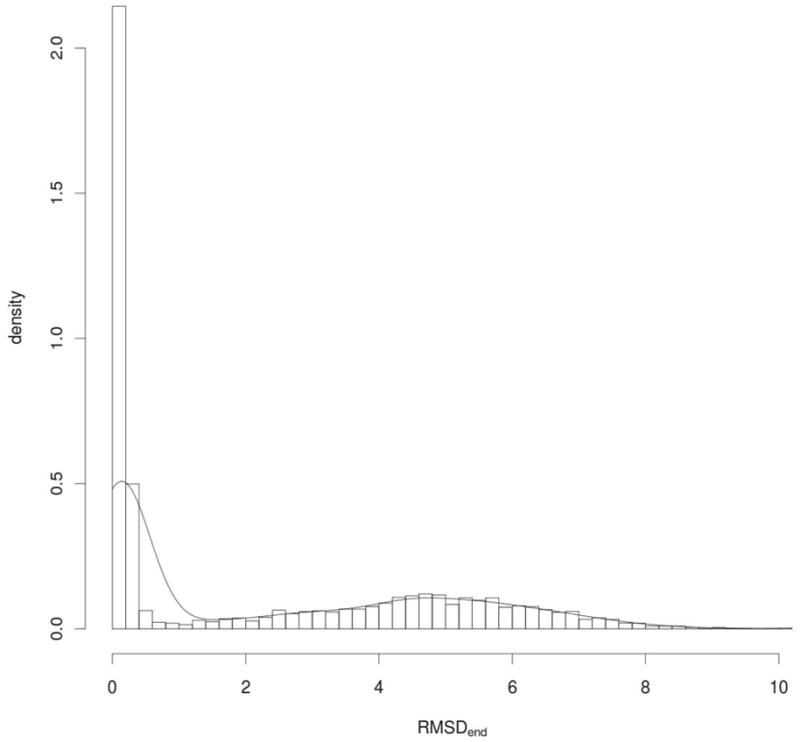
Figure 4.

Distribution of refinement results obtained from 5000 refinement trials for L=100, σC = 0.10, σN = 0.20, and initial RMSD=6.0Å. Black line shows density of probability of obtaining given results after 1000 iterations. The average RMSD value is 2.2Å. To visualize the results, the Gaussian kernel was applied to estimate density.
