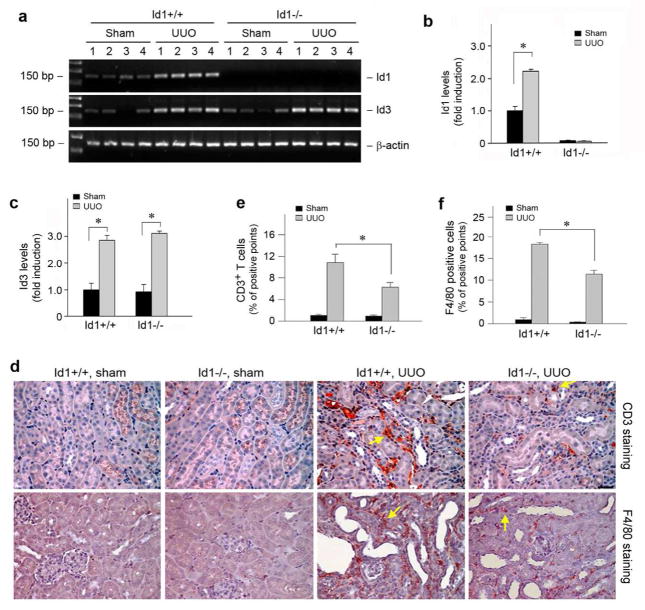
Figure 7. Genetic ablation of Id1 reduces the infiltration of T cells and monocytes/macrophages in obstructive nephropathy.
(a–c) RT-PCR analysis shows Id1 and Id3 mRNA expression in wild-type and Id1 knockout mice after UUO. Numbers denote each individual mouse in a given group. (a) representative RT-PCR data; (b, c) quantitative data of Id1 (b) and Id3 (c) mRNA levels. (d) Representative micrographs show the infiltration of CD3-positive T cells and F4/80-positive monocytes/macrophages in the obstructive kidneys of Id1 knockout mice and their control littermates. Kidney sections were stained with antibody against CD3 or F4/80 antigens. Yellow arrows show the infiltration of inflammatory cells. Bar = 25 μm. (e, f) Quantitative determination of the CD3-positive T cells (e) and F4/80-positive macrophages (f) in Id1 null mice and their control littermates at 7 days after UUO. *P < 0.05 (n = 6).

