Figure 6.
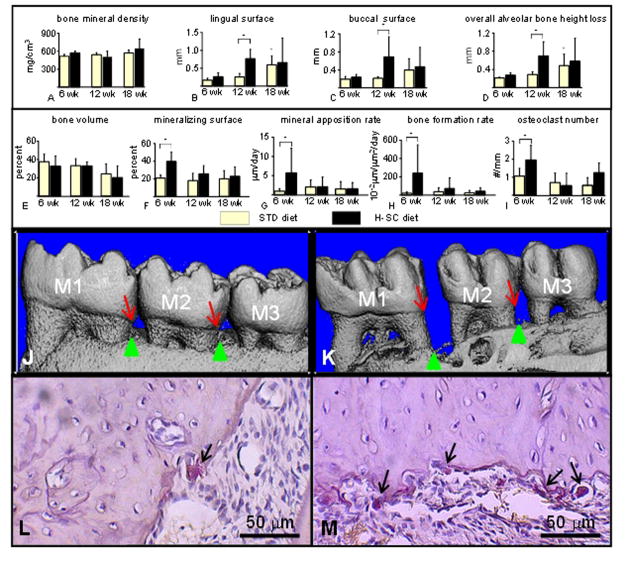
The high sucrose and casein (H-SC) diet increases mandibular vertical alveolar bone loss (ABL) in female rice rats after 12 wks, and increases alveolar bone remodeling at 6 wks but not at 12 and 18 wks in male rice rats. A microCT analysis was performed in the mandibles of female rats fed the standard (STD) and H-SC diets for 6, 12 and 18 weeks (A–D). Bone mineral density (BMD) (A), mandibular vertical ABL at the lingual surface (B), mandibular vertical ABL at the buccal surface (C) and overall alveolar bone height loss (D). All measurements were performed at the interproximal space between the first and second molars (M1–M2). A histomorphometric analysis was performed in the mandibles of male rats fed the standard (STD) and H-SC diets for 6, 12 and 18 weeks (E–I). Bone volume (BV/TV) (E), mineralizing surface (F), mineral apposition rate (G), bone formation rate (H), and osteoclast number (I). All measurements were performed within the region of interest (ROI) described in Figure 1. An asterisk denotes a significant difference from the STD diet at 6 weeks. A cross (†) above brackets indicates a significant difference from its respective time-matched STD control group. (P < 0.05). Comparative reconstructed microCT images taken from mandibles of female rice rats fed the STD (J) or the H-SC diets (K) for 12 weeks, respectively. Note the increased vertical ABL at the lingual surface in the interproximal spaces between molar (M) 1 and M2 and M2–M3 in a rat fed the H-SC diet (K) compared to an age-matched control rat (J). Red arrows depict the cementoenamel junction (CEJ) and green arrows the alveolar bone crest (ABC). Representative photos of histological sections stained for tartrate-resistant acid phosphatase (TRAP) taken at the mandibular interproximal space M1–M2 of a female rice rat fed the STD (L) or H-SC (M) diets for 6 wks, respectively. Note the presence of numerous big multinuclear or mononuclear purple stained osteoclasts (TRAP positive; black arrows) on an scalloped alveolar bone surface in a rat fed the H-SC diet for 6 wks (M) compared to the presence of only one TRAP positive cell (black arrow) on a smoother alveolar bone surface of a rice rat fed the STD diet for 6 wks (L). Figures L and M were taken at 400X magnification. H&E stain. Bars = 50 μm.

