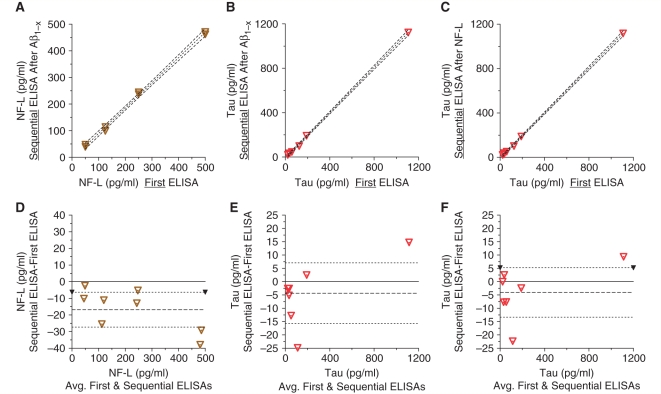
Figure 1.
Verification of the accuracy of sequential ELISA methods using mock microdialysis samples. Symbols indicate measured sample points. Dashed lines indicate linear best fits and 95% CIs. (A) NF-L sequential ELISA after Aβ1-x ELISA versus NF-L as the first ELISA: r2 = 0.99, slope 95% CI 0.90–0.99, y-intercept 95% CI −17.6 to 8.1. (B) Tau sequential ELISA after Aβ1-x ELISA versus tau as the first ELISA. r2 = 0.99, slope 95% CI 0.99–1.05, y-intercept 95% CI −20.5 to 2.3. (C) Tau sequential ELISA after NF-L ELISA versus tau as the first ELISA. r2 = 0.99, slope 95% CI 0.99–1.03, y-intercept 95% CI −17.7 to 3.4. (D–F) Bland-Altman plots for the data presented in panels (A–C).

