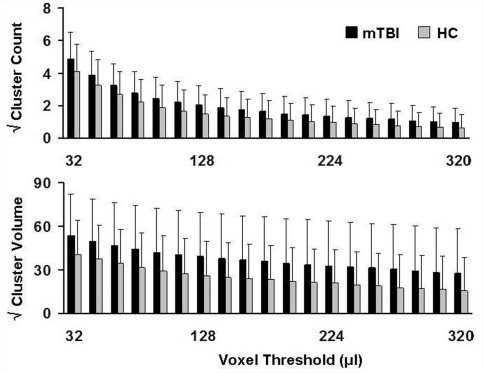
Figure 3.
Cluster results as a function of voxel threshold. The y-axis represents the square root of the mean number (top) and mean volume (bottom panel) for clusters exhibiting high anisotropy (z ≥ 2.0) in patients with mild traumatic brain injury (mild TBI; black bars) and healthy controls (HC; grey bars). The x-axis represents different minimal cluster volume thresholds, ranging between 32 and 320 µl. Error bars represent the standard deviation. A full range of voxel thresholds (16–1008 µl) are shown in Supplementary Fig. 1.

