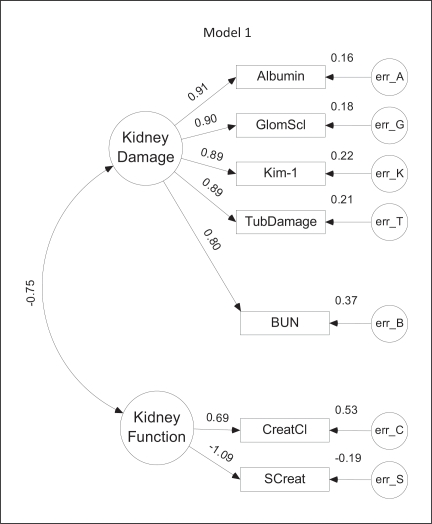
Fig. 2.
Model 1. The Fischer 344 CKD model generated from SEM studies. Large circles represent latent factors, which are unobserved variables and include the factors, function and damage. Rectangles represent variables that can be observed or directly measured. Single arrows represent a one-directional effect from one variable to another, while dual-head arrows represent factor covariances. Standardized path coefficients are indicated by the numbers above the arrows and represent the correlation or strength of the relationship between factors. A negative coefficient represents an inverse relationship between the variables, while a positive coefficient represents a direct relationship. Small circles (labeled err) represent variance in each observed variable that cannot be accounted for by the model, such as biological variability and measurement error. The magnitude of the error variance is indicated to the upper right of each observed variable. This model was ranked first based on the CAIC, indicating the most favorable balance between fit and complexity. Unlike models 2 through 5, the model includes only a single covariance–that between the latent variables.

