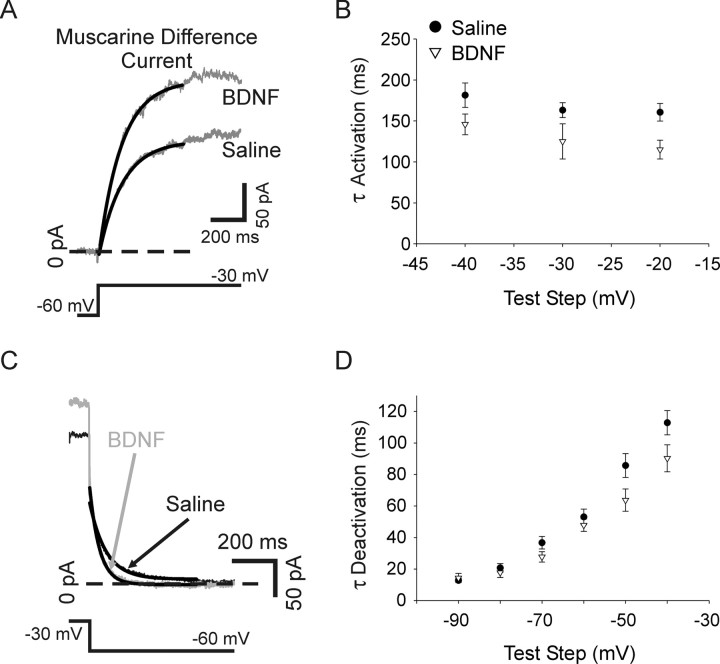
Figure 12.
The kinetics of activation and deactivation were not significantly altered by p75 activation. Single exponential functions (solid lines) fitted to muscarine difference currents elicited by depolarizing voltage steps to −30 mV from −60 mV for cells recorded from in saline or BDNF. B, A plot of the activation time constant (determined from exponential fits) shows no significant difference between saline (filled circles, n = 7) and BDNF (open triangles, n = 6) over test steps ranging from −40 mV to −20 mV. C, Single exponential functions (solid lines) fitted to muscarine difference currents generated with a hyperpolarizing pulse to −60 mV made from a holding potential of −30 mV for cells recorded from in saline (black) or BDNF (gray). D, A plot of the time constant of deactivation shows no significant difference between saline (filled circles, n = 7) and BDNF (open triangles, n = 6) with steps ranging from −40 mV to −90 mV.

