Figure 1.
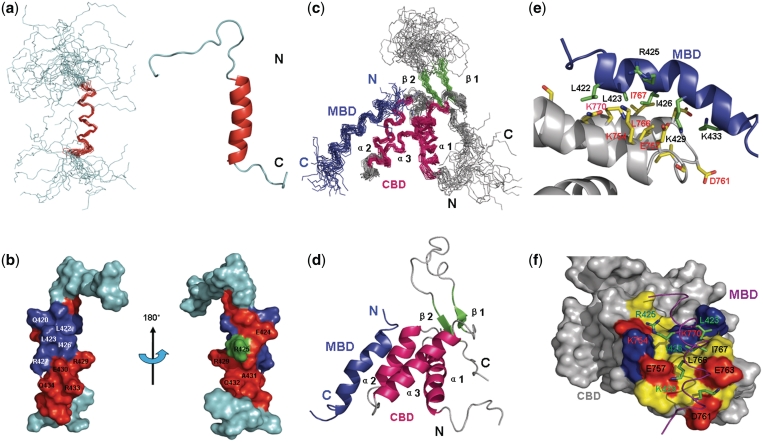
Solution structure of hMBD of human Cdt1 and the Mcm6-Cdt1 complex. (a) The left panel shows the backbone superposition of the 20 lowest-energy NMR structures of hMBD. The α-helix is colored red. N-terminal and C-terminal ends are indicated as N and C. The right panel shows a ribbon representation of the same structure of hMBD using the coordinates of the lowest energy structure. (b) Chemical shift perturbations in the presence of hCBD are colored onto the structure of hMBD in the surface representation. Residues with chemical shift perturbations ranging from 0.00 to 0.08 ppm are colored in green while residues with chemical shift perturbations larger than 0.08 ppm are shown in red and residues disappeared in HSQC spectrum are in blue. (c) Backbone superposition of the 19 lowest-energy NMR structures. Secondary structural elements of hCBD are color-coded: α-helices (red), β-strands (green), and loops (gray). hMBD is shown in blue. N-terminal and C-terminal ends are indicated as N and C. (d) Ribbon diagram of the complex using the coordinates of the lowest energy structure. (e) Expanded view of the complex binding surface. Residues having intermolecular NOEs are shown in sticks, yellow for hCBD and green for hMBD. The backbones of hCBD and hMBD are colored gray and blue respectively. (f) Surface representation of hCBD colored by residue type: red, acidic; blue, basic; yellow, hydrophobic; gray, non-interacting. hMBD is indicated as in (e) except that the backbone is in purple.

