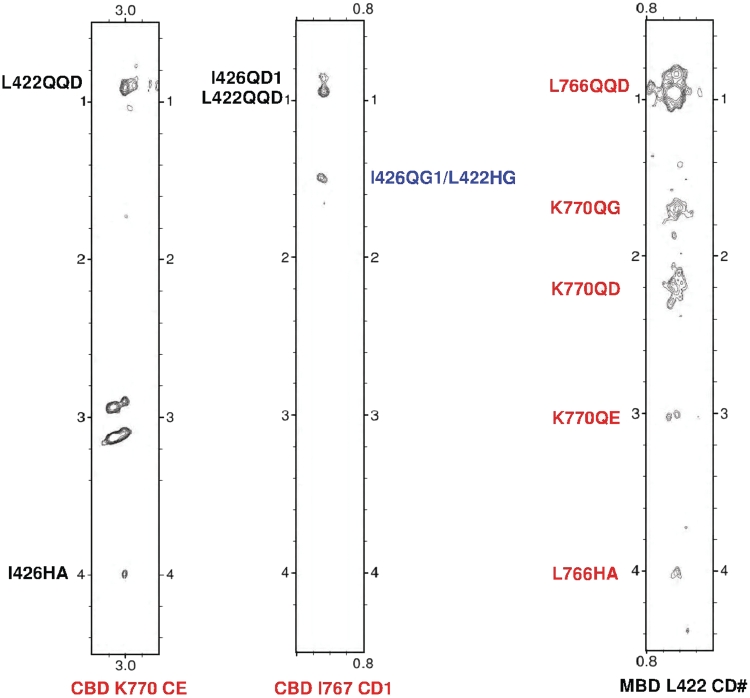
Figure 3.
Intermolecular NOEs between hCBD and hMBD. The left two strips of a 3D F1 13C,15N-filtered, F2 13C-edited NOESY-HSQC spectrum (150 ms mixing time) of a sample containing 13C,15N-labeled hCBD and unlabeled hMBD showing NOEs from the hMBD (I426, L422, the ambiguous assignment is colored by blue) to the hCBD (K770, I767). The right strip of the same experiment of a sample containing 13C, 15N-labeled hMBD and unlabeled hCBD showing NOEs from the hCBD (L766, K770) to the hMBD (L422). CD1: the ε1 carbon atom of the Isoleucine methyl group; CD#: degenerate pairs of Leucine methyl carbon atoms; CE: the ε carbon of the Lysine; HA: the α proton attached to α carbon; QG: degenerate pairs of γ methylene protons; HG: the γ proton of Leucine; QG1: degenerate pairs of Isoleucine γ1 methylene protons; QD: degenerate pairs of δ methylene protons; QE: degenerate pairs of ε methylene protons; QD1: degenerate pairs of Isoleucine δ1 methyl protons; QQD: degenerate pairs of Leucine methyl protons.

