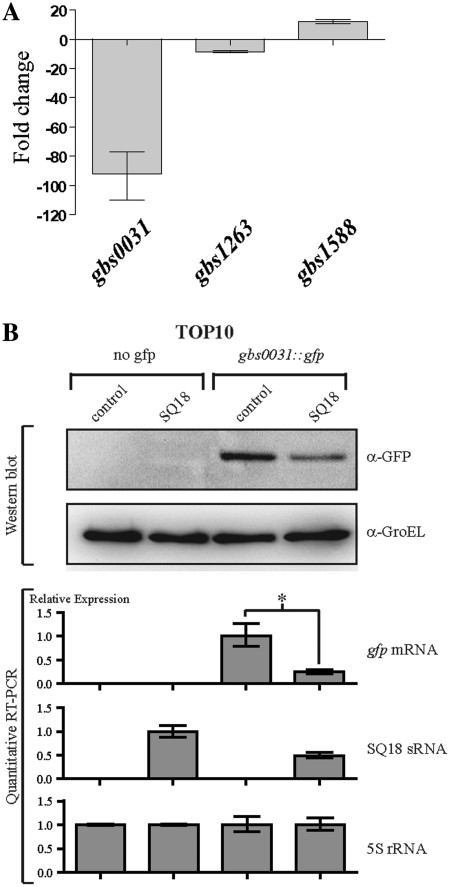
Figure 6.
SQ18, SQ893 and SQ485 sRNAs controlled the gbs0031, gbs1263 and gbs1588 target genes expression, respectively. (A) Quantitative real-time RT–PCR analysis of expression of gbs0031, gbs1263 and gbs1588 gene. The relative expression of the three mRNA genes were determined by comparing over-expressing strains S. agalactiae NEM316 + pTCV-SQ18 or pTCV-SQ485 or pTCV-SQ893 against the wild-type S. agalactiae NEM316 isolate. (B) Analysis by Western blot and quantitative RT–PCR of the expression of the gfp and SQ18 gene expression in E. coli TOP10 strain harboring pZE2R-SQ18 or mock plasmids combined with pXG-0 (no gfp target control) or pXGgbs0031::gfp expression plasmids. SQ18 expression was normalized to 1.0 for the TOP10 + pZE2R-SQ18 + pXG-0 strain. Asterisks indicate a significant difference between mean values in unpaired t tests (P < 0.01).

