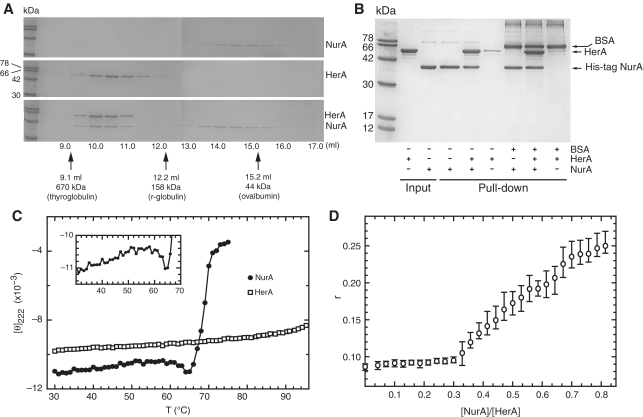
Figure 3.
Analysis of the physical interaction between S. solfataricus HerA and NurA. (A) Analytical gel filtration over an S200 Superdex HR 10/30 column. A total of 150 µg HerA (0.44 nmol of hexamer) and 90 µg NurA (1.15 nmol of dimer) were heated individually (top and middle panel) or together (bottom panel) at 60°C for 20 min before gel filtration. Protein fractions were separated by SDS–PAGE. Migration of molecular markers is indicated by arrows. (B) Pull-down assay confirming the HerA–NurA interaction. A total of 30 µg His-tagged NurA (0.38 nmol of dimer) was mixed with 50 µg untagged HerA (0.15 nmol of hexamer) at 60°C for 20 min. The complex was retrieved on nickel-agarose beads, and eluted by boiling. (C) Circular dichroism thermal melting profile. Mean residue elipticity at [θ]222 (×10−3) in degrees cm2 dmol−1 residue−1) as a function of temperature. Closed circles represent NurA (0.40 mg·ml−1), and HerA (0.47 mg·ml−1) is depicted by open squares. The insert is a detailed view of the low enthalpy transition for NurA between 30°C and 64°C. (D) Determination of the stoichiometry of the HerA–NurA complex by fluorescence anisotropy. HerA (0.62 µM) in buffer B plus 10 nM dsDNA with 5′ single-stranded overhangs (construct F2, Supplementary Data) were titrated with increasing concentrations of NurA. The abscissa axis shows the monomeric ratio of NurA to HerA. The open circles are the measurements mean (n = 3) and the vertical bars are the range of the error.

