Figure 1.
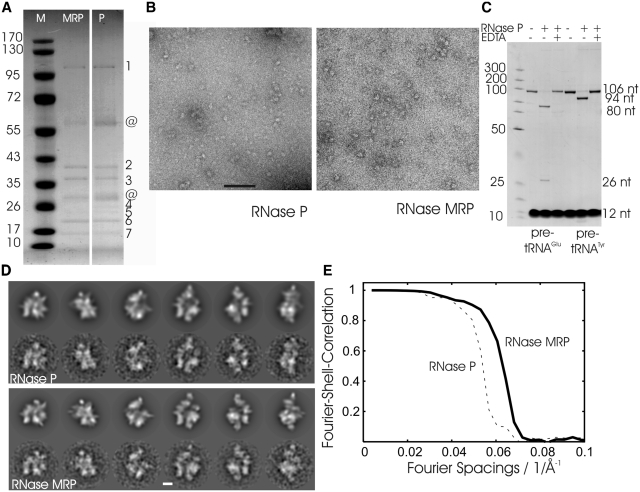
Characterization of the RNase P/MRP preparation. (A) Coomassie-stained SDS–PAGE of RNase P and RNase MRP. Left: marker with given molecular masses (Page Ruler™ Prestained Protein Ladder; Fermentas) in kDa; centre: HA eluate of Pop4–TAP HA-Snm1 (RNase MRP); right: HA eluate of Pop4–TAP Rpr2–HA (RNase P). Bands identified by mass spectrometry are indicated by numbers: (1) Pop1; (2) Pop4; (3) Snm1, Rpp1 for RNase MRP and Rpp1 for RNase P; (4) Nothing for RNase MRP and Rpr2 for RNase P; (5) Pop3, Rmp1, Snm1 for RNase MRP and Pop3, Pop1 for RNase P; (6): Pop5, Pop6, Pop7; (7): Pop8; @ contaminations. (B) Micrographs of negatively stained RNase P (left panel) and RNase MRP (right panel) from representative preparations. Scale bar: 100 nm. (C) In vitro activity assay of RNase P using two different pre-tRNAs. Leader sequences (26 nt and 12 nt for pre-tRNAGlu and pre-tRNATyr, respectively) are cleaved off by RNase P to give rise to tRNAGlu (80 nt) and tRNATyr (94 nt) with mature 5′-ends. No cleavage of pre-tRNA molecules occurs in the absence of RNase P or in the presence of RNase P with EDTA added to the reaction showing the dependency of the catalysis on magnesium ions. The reaction mixtures were separated on 12% polyacrylamide / 7 M urea gels and stained with 0.1% toluidine blue. The strong bands at the bottom are from bromphenol blue in the sample buffer. The position of marker fragments (GeneRuler™, UltraLow Range DNA Ladder, Fermentas) in bp is shown on the left. (D) Selected projections of the 3D map of RNase P (upper panel, upper row) and RNase MRP (lower panel, upper row) and matching class-averages calculated by multivariate statistical analysis (lower rows). Scale bar: 5 nm. (E) Fourier-shell-correlation for maps of RNase P (dashed) and of RNase MRP (solid).

