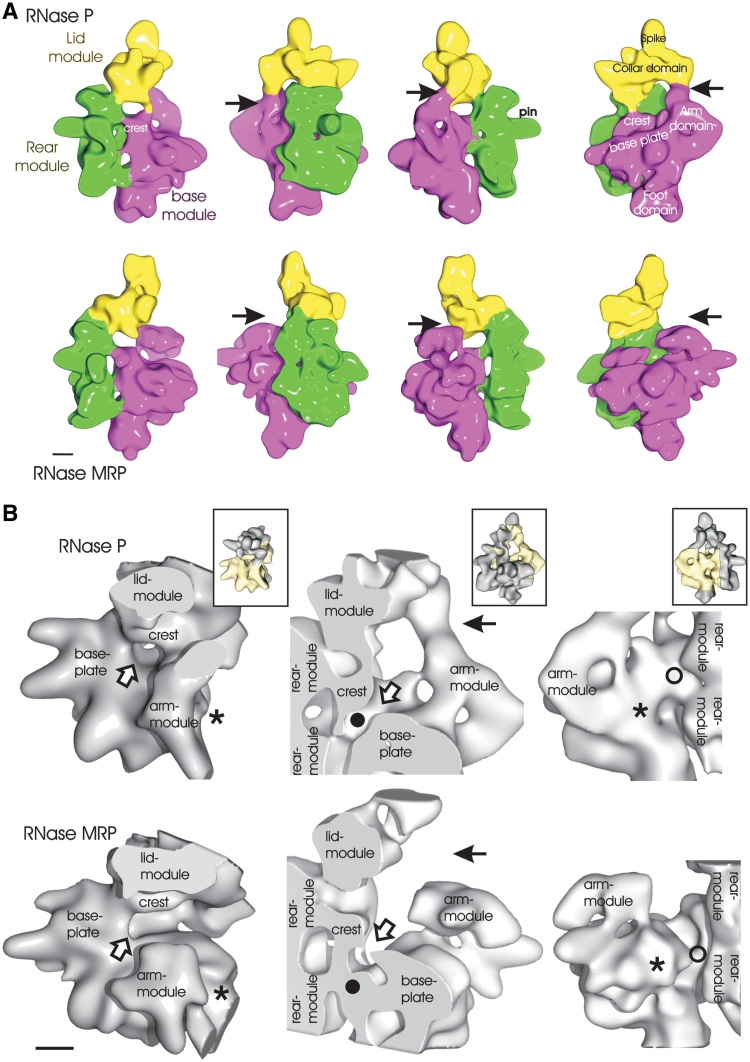
Figure 2.
Surface representation of RNase P and RNase MRP. (A) RNase P is shown in the top panel and RNase MRP in the bottom panel. The maps are rotated anti-clockwise in 90° steps around the long molecular axis. The different modules are colored, and the names of the modules are shown in the same color: base module (magenta); rear module (green); lid module (yellow). Different landmarks in the map are indicated. The arrow points at the interface between arm domain and lid module, which are in contact in RNase P and are separated in RNase MRP. (B) Close-up views of selected regions of RNase P (top) and RNase MRP (bottom), which differ most in the two complexes. In the inserts the whole complex is shown in the same orientation as the respective close-up and the part of the close-up is highlighted in yellow. Left panel: the entry to the channel (open arrow) is enclosed in RNase P and open to one side in RNase MRP (open arrow). RNase MRP has additional density close to the arm module (asterisk), which is missing in RNase P (asterisk). Central panel: RNase P and RNase MRP are cut at the same position through the centre of the channel. The channel is open in RNase P (filled circle) and blocked in RNase MRP (filled circle). The arm module is connected to the lid module in RNase P and separated in RNase MRP (arrow). Right panel: the channel is protected to the outside in RNase P (unfilled circle) and accessible in RNase MRP (unfilled circle). The additional density of RNase MRP (asterisk) is close to the arm module and gives rise to a protrusion that is missing in RNase P (asterisk). Scale bar: 2 nm.

