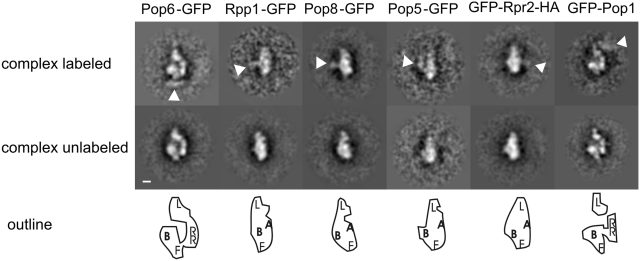
Figure 3.
Localization of RNase P subunits by antibody labeling. Sub-class averages with an extra density are shown in the upper row, in contrast to sub-class averages with no extra densities shown in the middle row. White arrowheads point to the position of the extra density due to the bound antibody. Scale bar: 2 nm. The bottom row shows the outline of the class averages of the unlabeled complex above. For clarity, the outline is enlarged by a factor of 2. The approximate positions of the domains are indicated by letters: A: arm domain, L: lid module; F: foot domain; B: base plate; RR: rear module [only shown in side views (panel 1 and 6) where it does not overlap with the arm module and base plate].

