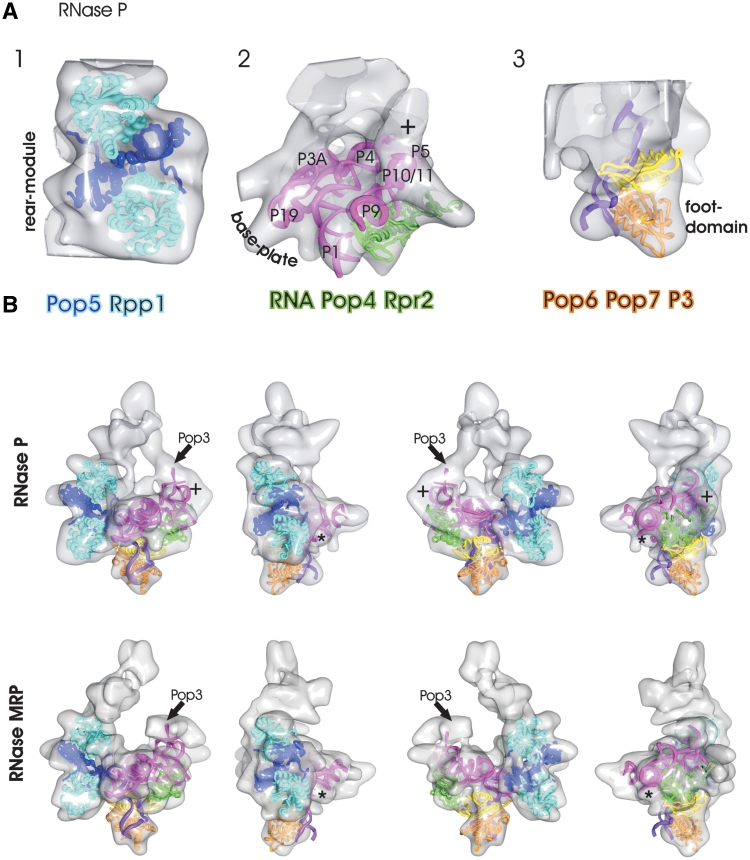
Figure 4.
Surface representations of the RNase P with fitted subunits: (A) Panel 1: heterotetramer [2CZV (29)] of the archaeal homologs of Pop5 (dark blue) and Rpp1 (light blue) are fitted to the rear module. Panel 2: model of S. pombe RNA (60) (magenta) and archaeal homologs of the Pop4–Rpr2 dimer [2ZAE, green (27)] fitted to the base plate. Panel 3: Pop6 (orange), Pop7 (yellow) and P3 loop (purple) [3IAB, (35)] fitted to the foot domain. (B) Fitted subunits (see A for color coding) superimposed to RNase P (top panel) and to RNase MRP (bottom panel). The views are rotated in 90°-steps around the y-axes. The ‘plus’ highlights unaccounted density at the end of the P10/P11 stem where 50 bases of the P12 stem are missing in the RNA model. The ‘asterisk’ highlights an unaccounted rod-shaped density at the start of the P3 bulge loop where 30 bases are missing in the RNA model. The arrow highlights the approximate position of Pop3. The local cross correlation between the maps and the fitted models are shown in Supplementary Figure S3.

