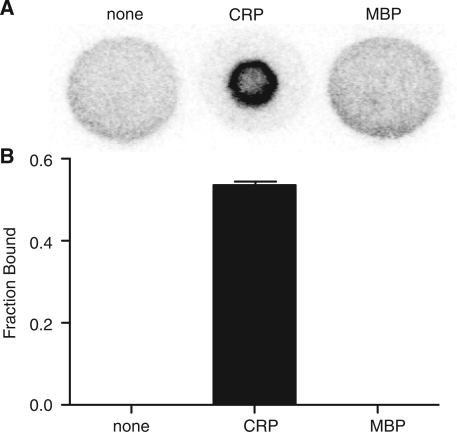
Figure 1.
Detection of protein–DNA interaction by DRaCALA. (A) Phosphorimager visualization of DRaCALA spots of indicated proteins at 100 nM mixed with 4 nM 32P-labeled ICAP fragments and 200 µM cAMP show distributions of the radioligand, which are diffused and homogenous (no protein, MBP) or sequestered (CRP). (B) The fraction bound was quantified using the formula in the ‘Methods’ section and error bars indicate the SD for three spots.

