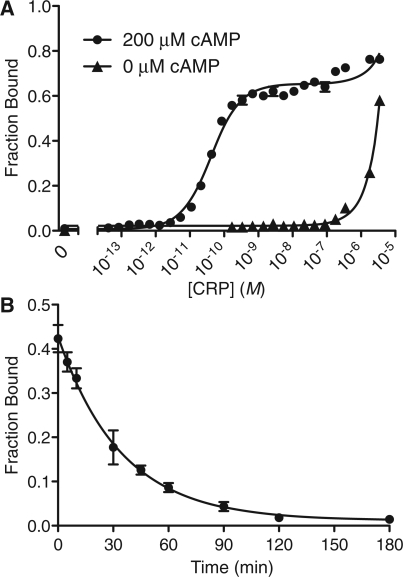
Figure 5.
Affinity and kinetics of DNA-binding determined using 5 pM whole-plasmid probe with a single ICAP site. (A) Graphs of fraction of ICAP plasmid bound by various concentrations of CRP with indicated levels of cAMP (Kd reported in Table 1). (B) Graph of observed off-rate of koff = 4.8 ± 0.17 × 10⁻⁴ s−1 (SD) for ICAP plasmid generated by adding 1000-fold unlabeled PCR product (1× ICAP) competitor to 5 nM CRP with plasmid probe and spotting at time points >3 h. All error bars represent SDs of three spots.

