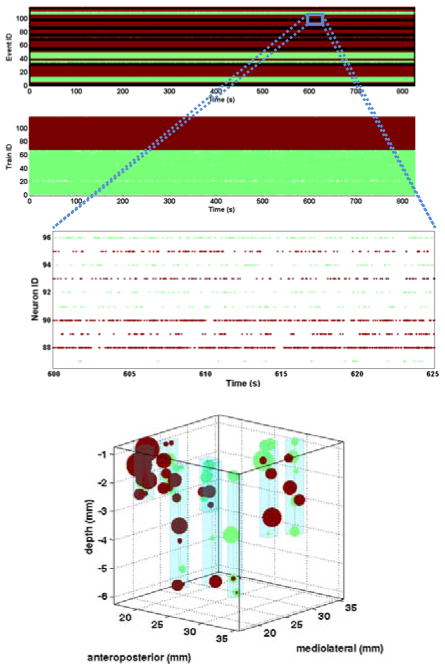
Figure 2.
A) Grouping of neurons from all seven arrays into one of two groups (green, red), ordered by neuron number in each array (top) and group number (bottom). B) Zooming in on a 25 sec window for sample M1 neurons reveals differences in neuronal response for members of each group, primarily based on firing rate C) Spatial distribution of neurons across all eight arrays. The size of each sphere represents how strongly the neuron belongs to its group, and color indicates group membership. Light blue cubes indicate the volume occupied by each FMA.

