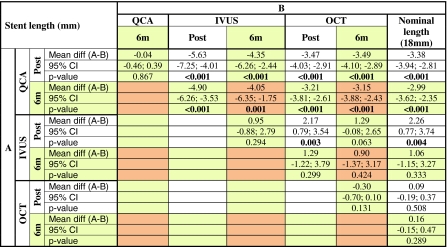
Table 2.
Stent length measured by the different imaging modalities immediately post-stenting and at 6 months follow-up
“Chess table” showing the paired comparison of the means: white cells for post-post; yellow cells for post-6m; orange cells for 6m–6m comparisons
CI confidence interval, IVUS intravascular ultrasound, OCT optical coherence tomography, QCA quantitative coronary angiography, 6m 6 months follow-up

