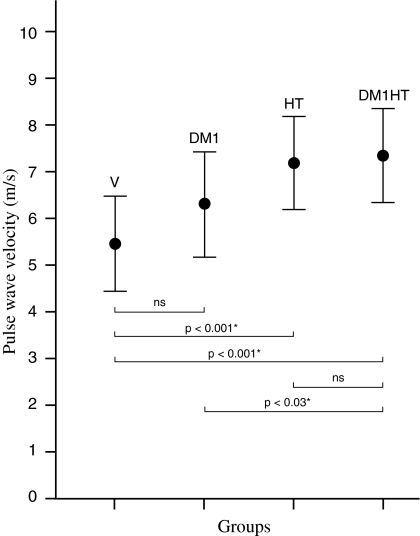
Fig. 1.
Difference in aortic PWV between subgroups corrected for age and sex. V Healthy volunteers, DM1 type-1 diabetes mellitus patients, HT hypertension patients, DM1HT type-1 diabetes mellitus patients with hypertension. Means ± SE per subgroup are given and P-values between subgroups are presented below. * P < 0.05. ns: non-significant

