
Figure 1.
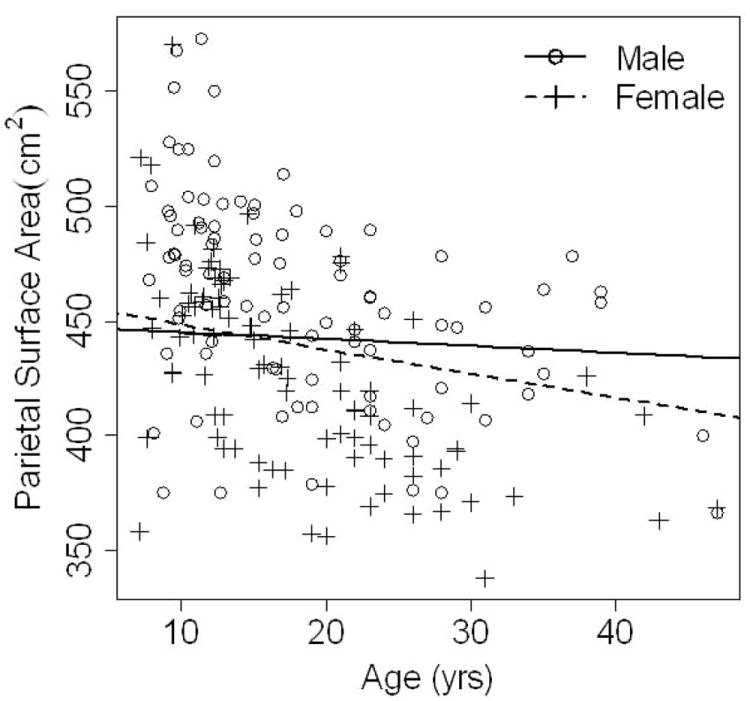
Parietal surface area is shown on the y axis, plotted against age on the x axis. Exponential decay curves are plotted for males (solid line) and females (dotted line) at the mean value of total cerebral surface area. The rate of change in parietal surface area over time for males is very slight (not significantly different from a factor of 1) indicating little change in surface area over time. However, the rate of change for females is smaller than 1 indicating more significant decrement in surface area over time resulting in a lower parietal surface area compared to males by the adult years.