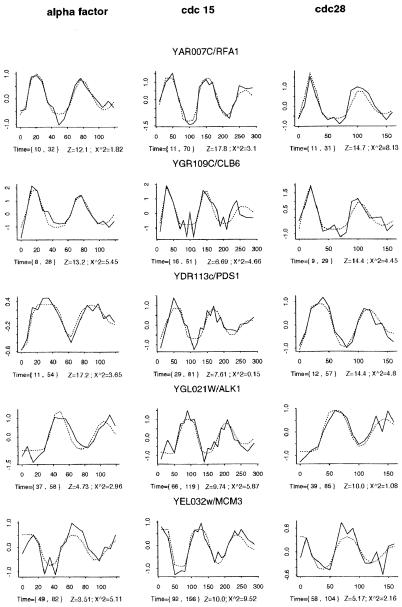
Figure 3.
The fit of the SPM (dotted lines) to the microarray data (solid lines) from three different synchronized cell cycles for five periodically transcribed genes. The logarithmic ratio data versus time is plotted for the alpha factor (Right), cdc15 (Center), and cdc28 (Left) synchronies. Beneath each plot, the times of activation and deactivation for each transcript are shown in brackets, followed by Z score and χ2 statistic calculated under SPM, which indicate the significance of the pulse height and deviation from SPM, respectively.

