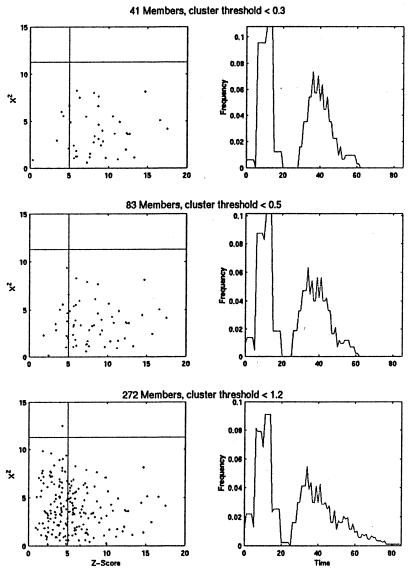
Figure 4.
Periodic transcripts that peak in the G1 phase of the cell cycle were identified by Heyer et al. (11) using the QT_Clust algorithm and varying the cluster diameter threshold from <0.3 (top 41 genes), to <0.5 (83 genes), to <1.2 (272 genes). The transcript profiles for members of these successively larger G1 clusters were analyzed by SPM, and their Z and χ2 values are plotted (Left). The Z score and χ2 thresholds of SPM are superimposed on these plots to show that the proportion of these profiles that would be classified as periodic (lower right quadrant of each plot). (Right) the distribution of mean activation and deactivation times is plotted for each group. These parameter estimates were calculated by SPM only for those profiles that exceed SPM thresholds.

