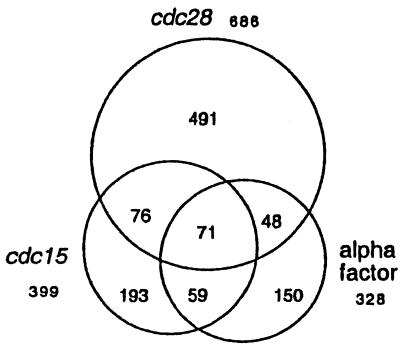
Figure 5.
Periodic transcripts identified by SPM with thresholds of |Z| >5 and χ2 < 11.3 are depicted to show the extent of agreement between the three data sets. Logarithmic ratio data provided by Spellman et al. (9) for each of the three data sets was analyzed by SPM. The total number of periodic genes identified in each data set is shown and is represented by a circle. Agreement between data sets is indicated by the intersections of the circles. A total of 71 genes meet the SPM threshold for periodicity in all three data sets; 254 score as periodic in at least two databases; 834 appear periodic in only one data set; and 1,088 meet the SPM threshold in only one database. If we use an additional criterion of R2 > 0.6 to identify the profiles among these 1,088 for which the model provides an explanation for 60% or more of the expression data variation, we find 473 profiles. This list is available at our website (www.fhcrc.org/labs/breeden/SPM).

