
Figure 2.
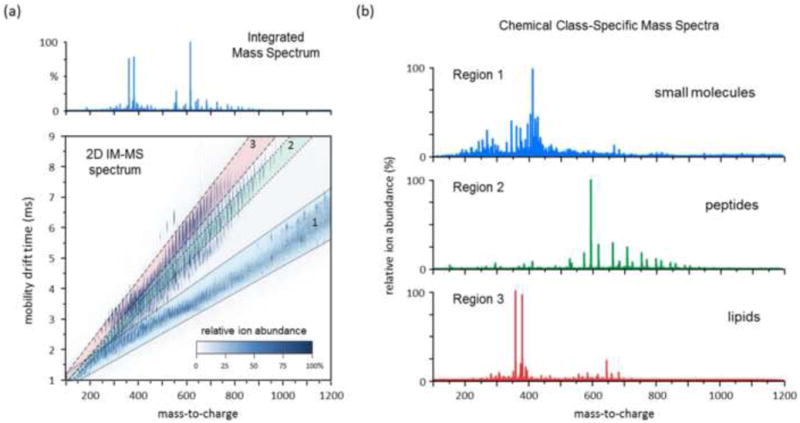
An example of the analytical utility of IM-MS for the separation of different chemical classes. (a) The combined 2-dimensional IM-MS spectrum acquired from a methanol extract of whole rat blood. The integrated mass spectrum (top panel) represents the typical spectrum which would be obtained using a conventional single-dimension of MS analysis. (b) Chemical class-specific mass spectra extracted from the 2D spectrum in (a). Three regions of the data are highlighted, which contain chemical signals predominately represented by small molecule metabolites, peptides and lipids. This data was acquired on a commercial traveling wave instrument by directly infusing the desalted blood extract sample.