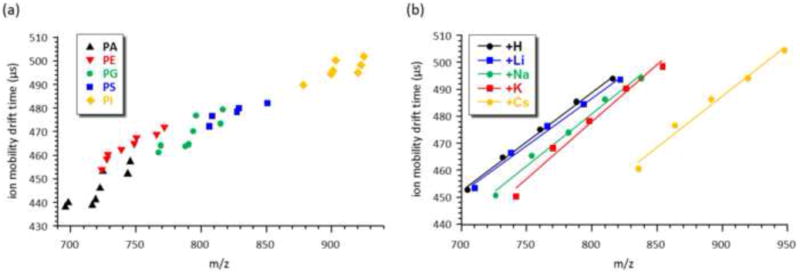
Figure 3.

(a) IM-MS data plot of several lipid extracts obtained with MALDI-DTIM-MS. Individual lipid classes cluster in regions of IM-MS space which are ascribed to differences in head group, acyl chains, and cation. (b) Shifts in the drift time and m/z observed for saturated SM lipids coordinated to different cation groups. Panels (a) and (b) were adapted from Figures 3 and 4 in Springer and Elsevier, J. Amer. Soc. Mass Spectrom. 19(11), 2008, 1655-1662, A Study of Phospholipids by Ion Mobility TOFMS, Jackson, S. N.; Ugarov, M.; Post, J.D.; Egan, T.; Langlais, D.; Schultz, J. A.; Woods, A. S., © 2008 American Society for Mass Spectrometry, with kind permission from Springer Science+Business Media B.V.
