
Figure 5.
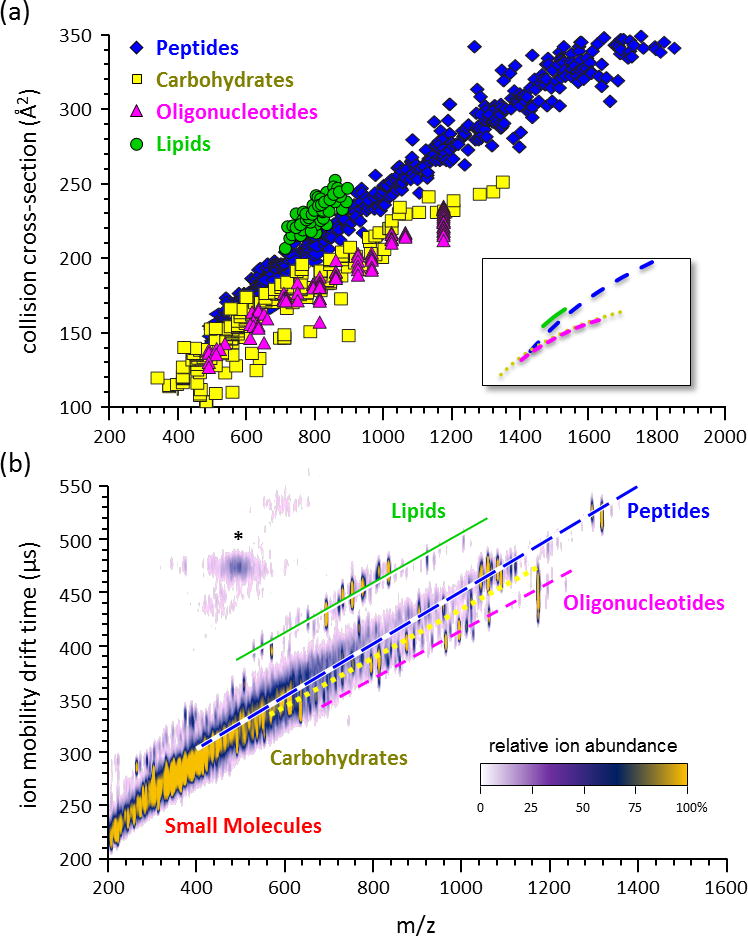
(a) A plot of collision cross-section vs. mass-to-charge measured from a large sample of various biomolecular classes, including peptides (n=610), carbohydrates (n=192), oligonucleotides (n=96), and lipids (n=53). The average mobility-mass correlation lines are contained in the inset, which represents logarithmic regression fits to the data. (b) An empirical 2D IM-MS spectrum of ion mobility drift time vs. mass-to-charge obtained on a DTIM-MS instrument for a complex sample containing a mixture of different biomolecular classes. The lines are provided for visualization purposes only. Signals in the vicinity of the asterisk (*) represent limited post-IM fragmentation of the high abundant peptide signals. Note that in the 2D plots lipid signals appear significantly removed from the other chemical signals. Panels (a) and (b) are adapted from Springer, Anal. Bioanal. Chem. 394(1) 2009, 235-244, Characterizing Ion Mobility-Mass Spectrometry Conformation Space for the Analysis of Complex Biological Samples, Fenn, L.S.; Kliman, M.; Mahsut, A.; Zhao, S.R.; McLean, J.A.; from Figure 1 © Springer-Verlag 2008 with kind permission from Springer Science+Business Media B.V.