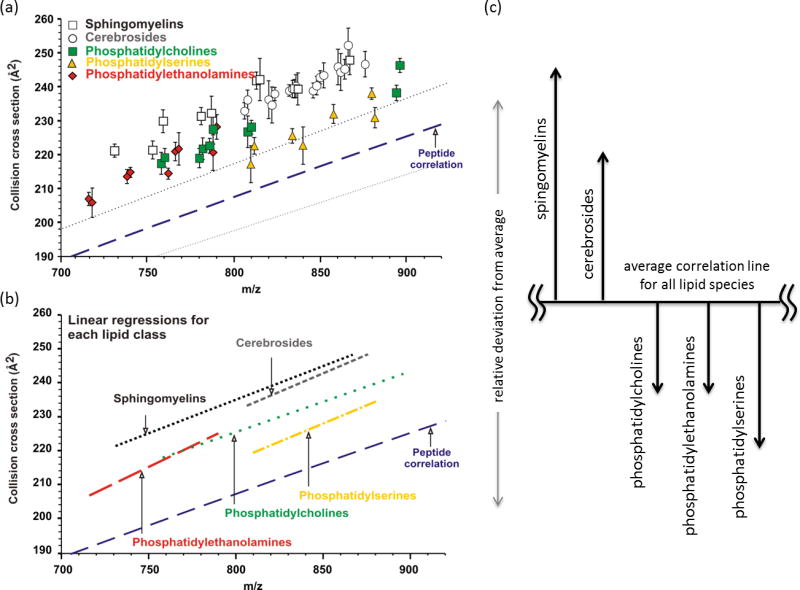
Figure 6.

(a) A plot of average collision cross-section versus m/z for 44 intact lipid signals from five lipid extracts (Avanti, Birmingham, AL). Signals are shown in relation to the average peptide correlation line. (b) Linear regression fits through all signals corresponding to the indicated lipid class. (c) The expected deviation of various lipid molecular classes from the average lipid mobility-mass correlation line. Panel (c) was adapted from Springer and Elsevier J. Amer. Soc. Mass Spectrom. 20(10), 2009, 1775-1781, The Mass-Mobility Correlation Redux: The Conformational Landscape of Anhydrous Biomolecules, McLean, J.A.; from Figure 3 © 2009 American Society for Mass Spectrometry with kind permission from Springer Science+Business Media B.V.
