
Figure 7.
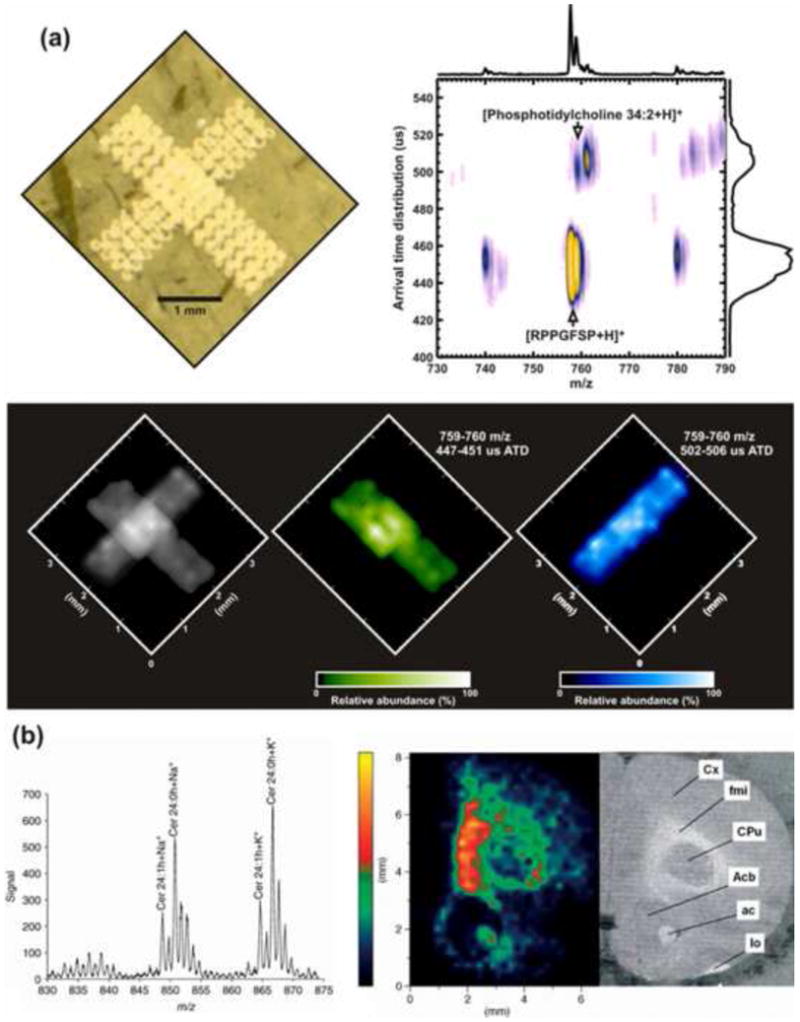
(a) Imaging DTIM-MS experiment of two nominally isobaric analytes, the peptide RPPGFSP and lipid PC 34:2. (a, left panel) An optical image of both analytes deposited onto a thin (12 mm) mouse liver tissue section in the pattern of an “X”. (a, right panel) Resulting DTIM-MS spectrum of the overlapping region of the two analytes. The IM-MS signal intensity is indicated by false coloring, where purple and yellow corresponds to the least and most intense signals, respectively. (a, bottom panel) Image maps generated using only the MS data, to left, and the combined IM-MS data, right. (b) Imaging IM-MS analysis of cerebrosides obtained from rat brain tissue. (b, left panel) Combined MS spectrum of sodium and potassium coordinated cerebroside 24:0 OH (m/z = 850.7) ion signal. (b, middle panel) Image map of the sodiated cerebroside 24:0 OH isolated from the IM-MS data. (b, right panel) Optical image of an adjacent rat brain section. Histological abbreviations are as follows: Cx - cortex; fmi -forceps minor of the corpus callosum; Cpu - caudate putamen (striatum); Acb - nucleus accumbens; ac -anterior commissure; lo - lateral olfactory tract. Panels (a) and (b) are adapted from Ref. [80] and Ref. Ref. [75], respectively, with permission. Copyright © 2007 Wiley-Liss, Inc.